Guide · 12 min read · 3,204 words
Deciphering the Quote Board: Your Guide to Trading Prices
Learn to confidently read bid and ask prices, spreads, and market depth without confusion, making clearer trading decisions.

Key takeaways
- The 'bid' is the highest price a buyer offers, and the 'ask' (or 'offer') is the lowest price a seller accepts.
- The 'spread' is the difference between the bid and ask, representing the cost of your trade and the broker's compensation.
- Real-time market quotes are crucial; delayed data can lead to missed opportunities and inaccurate fills.
- Market depth (Level 2 data) shows multiple layers of buyers and sellers, offering insights beyond just the best bid/ask.
- Understanding your broker's execution model (Market Maker vs. ECN) affects how you interpret the quotes you see.
- Always consider external factors like economic news releases, which can cause significant and rapid quote changes.
The Numbers Staring Back: Your First Look at a Quote Board
Picture this: you've just opened your trading platform, eyes scanning the screen. Amidst the flashing colours and charts, a pair of numbers stands out, side by side, constantly changing. For newcomers, these numbers can feel like a secret code, just two figures that somehow dictate whether you buy or sell, and for how much. Is the higher one the price you pay, or the lower one? It's a common moment of hesitation, a quick mental flip-flop trying to recall which is which. This initial confusion is perfectly normal, a rite of passage for anyone stepping into the market.
That pair of numbers is the quote board, the heartbeat of your trading decisions. It's not just abstract data; it's the live conversation happening between buyers and sellers, right there on your screen. Understanding this conversation is fundamental. Without a clear grasp of what these numbers signify, you're essentially placing trades blind, hoping for the best rather than making informed choices based on current market conditions. It's like trying to drive a car by only looking at the speedometer, ignoring the road ahead.
My goal here is to strip away that initial mystery. We're going to break down these numbers, one by one, so that when you look at a quote board, you see clarity, not a puzzle. We'll uncover what each digit means, why they move, and how they connect to your trades. This isn't about memorising definitions; it's about building an intuition, a sixth sense for what the market is telling you at any given moment. Let's make sure that hesitation melts away, replaced by confidence.
The Core Duo: Bid and Ask Explained
Every trading instrument, from a major currency pair like EUR/USD to a stock like Apple, always shows at least two prices: the Bid and the Ask. Imagine walking into an airport currency exchange booth. They have a price to buy your foreign currency (the lower price) and a different, higher price to sell it to you. This is exactly how it works on your trading platform. The Bid price is the highest price a market buyer is currently willing to pay for an asset. If you want to sell an asset immediately, you will sell it at the prevailing bid price. It's the maximum price you can get right now to offload your holdings. On your trading platform, it's typically the lower of the two main prices shown. The Ask price (sometimes called the 'Offer price') is the lowest price a market seller is currently willing to accept for an asset. If you want to buy an asset immediately, you will pay the prevailing ask price. This is the minimum price you'll hand over to acquire the asset right now. It's consistently the higher of the two main prices on your screen. To simplify: you buy at the Ask, and you sell at the Bid. Always. This simple rule forms the bedrock of understanding any quote board. Grasping this eliminates much initial confusion. It seems basic, but many new traders stumble here, and it's fundamental to placing orders correctly.
The Spread: Your Trading's Hidden Cost and Broker's Reward
With an understanding of Bid and Ask, the next puzzle piece is the difference between them. This difference, called the spread, is a very important number for several reasons. First, it represents the immediate cost of entering a trade. The moment you buy at the ask and then hypothetically sell instantly at the bid, you've already incurred a loss equal to the spread. This isn't a glitch; it's how the market and your broker operate. Second, the spread is primarily how your broker makes money on your trades. When you buy at the Ask, your broker might be selling it to you for slightly more than they bought it for. When you sell at the Bid, your broker might be buying it from you for slightly less than they sell it for. They act as an intermediary, facilitating your trade and taking that small slice, the spread, as their compensation. For many retail brokers, especially those offering 'commission-free' trading, the spread is their main revenue stream. Spreads aren't static; they fluctuate. They can be fixed (less common for volatile assets) or variable. Variable spreads expand and contract based on market liquidity and volatility. Spreads can widen significantly during major news events, like the release of the US Bureau of Labor Statistics' Employment Situation report, as fewer buyers and sellers commit at tight prices and market makers adjust their risk. They typically tighten during liquid trading hours for a currency pair. A tighter spread is generally better for you, the trader, as it reduces your transaction cost. Here’s a look at how spreads might vary for a common pair like EUR/USD under different market conditions. Keep in mind these are illustrative figures; actual spreads will differ by broker and specific time of day. Most guides skip this part, but understanding spread behavior is crucial for managing your trading costs effectively.
Illustrative Spreads for EUR/USD in Pips
| Market Condition | Typical Spread (Pips) | Impact on Trader |
|---|---|---|
| Normal Trading Hours | 0.5 - 1.5 | Low transaction cost |
| Major News Release | 5.0 - 15.0+ | High transaction cost, increased slippage risk |
| Overnight/Low Liquidity | 2.0 - 4.0 | Moderate transaction cost, wider entry/exit |
| Cross Currency Pairs (e.g., EUR/JPY) | 1.5 - 3.0 | Generally wider than major pairs |
| Exotic Pairs (e.g., USD/TRY) | 10.0 - 50.0+ | Very wide, high transaction cost |
Execution Models: Market Makers vs. ECNs
The way your broker handles your trades directly influences the quotes you see and the spreads you pay. There are two primary models to understand: Market Makers and Electronic Communication Networks (ECNs) or Straight Through Processing (STP) brokers. Each has its own characteristics, and knowing the difference helps you choose a broker that aligns with your trading style.
A Market Maker broker literally 'makes' the market for you. They act as the counterparty to your trade. If you buy EUR/USD, they are selling it to you from their own inventory. If you sell, they are buying it from you. Their quotes are typically derived from the broader market but can be adjusted by the broker. They profit from the spread and sometimes from your losses, as your loss is their gain when they are the counterparty. Brokers like XM and OANDA can operate as market makers, providing liquidity directly.
ECN/STP brokers, on the other hand, route your orders directly to a pool of liquidity providers (major banks, other brokers, hedge funds). They don't take the other side of your trade. Instead, they find the best available Bid and Ask prices from their liquidity pool and pass them on to you. For their service, they typically charge a small commission per trade, but offer much tighter, often raw, spreads. Brokers like Pepperstone and IC Markets offer ECN-like accounts. The quotes you see on an ECN platform are generally a true reflection of the interbank market's best available prices.
Neither model is inherently 'better' than the other; it depends on your priorities. If you prioritise simplicity and fixed spreads (when available), a market maker might suit. If tight spreads and direct market access are your priority, an ECN/STP model is usually preferred. The key is to know which model your broker uses and understand its implications for your trading costs and execution quality. In practice, many brokers offer both account types.
Beyond the Best Offer: Peering into Market Depth
While Bid and Ask offer the best available prices, they only tell part of the story. To understand the market more deeply, especially for larger orders or gauging market sentiment, you need to look at Market Depth, often called Level 2 data. Most retail platforms show only the top of the order book – the single best Bid and Ask. Level 2, however, displays multiple layers of pending buy and sell orders at various prices beyond the best. Imagine the traditional quote board as just the first row of a large waiting list. Market depth is like seeing the entire list: who wants to buy or sell, at what specific price, and for what quantity. On the 'Bid' side, you'll see prices progressively lower than the best bid, with corresponding quantities. On the 'Ask' side, you'll see prices progressively higher than the best ask, again with associated quantities. This layered view offers a much richer understanding of supply and demand. For example, if a very large quantity of buy orders (bids) stacks up at a slightly lower price, this suggests strong buying interest at that level, potentially acting as support. The opposite holds true for sell orders: a large quantity of sell orders (asks) stacked above the current ask price might indicate resistance. This information is invaluable for anticipating where price might struggle to move or where it might find solid footing. While not all retail brokers provide full Level 2 data for all instruments, many offer it for popular assets or via premium accounts. It's particularly useful for day traders and scalpers who operate on very short timeframes and need to see exactly where liquidity is concentrated.
You buy at the Ask, and you sell at the Bid; this simple rule is the bedrock of understanding any quote board.
Your Orders, Their Footprint: How You Interact with the Quote Board
The quotes you see aren't just passive information; they're dynamic, constantly reacting to new orders entering the market, including yours. How you choose to place your trade affects how you interact with these prices. Understanding different order types is critical for managing your entry and exit points effectively.
A Market Order is the simplest: you tell your broker to buy or sell immediately at the best available price. When you execute a market order, you're essentially taking the best price currently offered on the opposite side of the spread. If you're buying, you'll hit the ask price. If you're selling, you'll hit the bid price. The advantage is immediate execution, but the disadvantage is that the exact price might vary slightly from what you saw an instant before, especially in fast-moving markets – this is known as slippage.
A Limit Order gives you more control over the price. Instead of taking the current best price, you specify the exact price at which you want to buy or sell. If you want to buy EUR/USD at 1.0850, and the current ask is 1.0855, you place a buy limit order at 1.0850. Your order will only be filled if the market price falls to 1.0850 or lower. Your limit orders help avoid slippage and can potentially give you a better entry price, but there's no guarantee of execution. If the price never reaches your specified limit, your order simply won't be filled. These orders contribute to the market depth we just discussed, sitting in the order book waiting to be matched.
Consider the practical differences between account types when placing orders. Some brokers offer different execution mechanisms depending on whether you're using a 'Standard' or an 'ECN' type of account. These differences can impact how your orders are filled and the costs involved. Here's a brief comparison of some characteristics:
Comparison of Standard vs. ECN Account Quote Characteristics
| Feature | Standard Account (Typical) | ECN Account (Typical) |
|---|---|---|
| Spread Type | Often wider, sometimes fixed | Raw, very tight (interbank) |
| Commissions | Usually none (spread-based) | Per-trade commission applied |
| Market Depth (Level 2) | Rarely available | Often available |
| Execution Speed | Good, but potentially subject to re-quotes | Very fast, direct market access |
| Counterparty | Broker (Market Maker) | Liquidity Providers (STP) |
| Minimum Deposit | Lower (e.g., $50-$100) | Higher (e.g., $200-$500) |
The Race Against Time: Real-Time Versus Delayed Quotes
In the fast-paced world of trading, timing is everything. The quotes you see on your screen need to reflect the market as it is right now, not minutes ago. This is the difference between real-time quotes and delayed quotes. For active traders, relying on anything other than real-time data is like trying to catch a moving train by watching its previous position.
Real-time quotes are exactly what they sound like: prices that update continuously, reflecting every single change in the bid and ask as orders are placed and filled across the market. These are essential for day traders, scalpers, and anyone making quick decisions based on current price action. Most reputable brokers provide real-time quotes for their live trading accounts. They receive these data feeds directly from liquidity providers or exchanges, ensuring you have the most up-to-date information at your fingertips.
Delayed quotes, on the other hand, are quotes that are delivered with a time lag, often 15-20 minutes behind the actual market. Some free charting services or demo accounts might use delayed data to reduce their costs or to differentiate from their premium offerings. While delayed quotes can be fine for long-term investors who only check prices occasionally, they are a significant disadvantage for active traders. Trying to execute a trade based on a price that's 15 minutes old is a recipe for bad fills and unexpected slippage. You might see an attractive price, place your order, only to find it filled at a drastically different (and usually worse) price because the market has moved significantly during the delay.
Always confirm that your trading platform is providing real-time data for the instruments you trade. This is especially true if you are using a free charting tool or a demo account for practice. While a demo account provides valuable experience, remember that it's a simulation. The prices might be real-time, but the execution dynamics – specifically, how your order interacts with market depth and liquidity – can sometimes differ slightly from a live account.
How Your Broker Presents the Numbers
Different trading platforms and brokers have their own ways of displaying quote information, even though the underlying Bid and Ask principles remain the same. Familiarity with your specific platform's interface is key to efficient trading. While the core numbers are universal, the surrounding context and additional information can vary significantly.
Platforms like MetaTrader 4 (MT4) and MetaTrader 5 (MT5), offered by brokers such as Pepperstone, XM, and IC Markets, typically present a simple 'Market Watch' window. Here, you'll see a list of currency pairs or other assets, each with its Bid and Ask price prominently displayed. You might also see a 'Spread' column that shows the current difference in pips, and sometimes 'High' and 'Low' prices for the day. These platforms are generally straightforward, but you might need to right-click and customise columns to see all the data you need.
Proprietary platforms, like those developed by OANDA or FOREX.com, or social trading platforms like eToro, often aim for a more user-friendly or feature-rich experience. They might integrate charts directly with the quote, offer one-click trading buttons, or display additional metrics like 'daily change' or 'sentiment indicators' alongside the core quote. While these can be helpful, always ensure you can easily identify the raw Bid and Ask prices without distraction.
Regardless of the platform, look for clarity. Can you quickly identify the buy price and the sell price? Are the updates continuous and smooth? Does the platform clearly indicate if the data is delayed? Understanding your platform's nuances, even down to the colour coding (red for sell/bid, blue for buy/ask is common but not universal), will reduce friction and help you make quicker decisions during active trading. Don't be afraid to spend time exploring your platform's features in a demo environment before committing real capital.
Connecting the Dots: Quotes, News, and Price Action
Understanding the Bid and Ask is just one piece of the puzzle. For informed trading, you need to connect these live quotes with broader market information, primarily economic news and chart-based price action. The quote board is reactive; news and market sentiment are the forces that make it react.
Major economic news releases, such as interest rate decisions from central banks (like the ECB's euro reference rates) or key employment figures (like those from the US Bureau of Labor Statistics), can cause immediate and dramatic shifts in Bid and Ask prices. These shifts happen in milliseconds. During such announcements, spreads often widen significantly, and prices can gap, meaning trades might execute far from the last quoted price. Monitoring an economic calendar is crucial, as it allows you to anticipate these periods of high volatility and adjust your trading strategy accordingly – perhaps by avoiding trades during the initial reaction or by using wider stop-losses.
Price action, as seen on your charts, provides a visual history and real-time context for the quotes. Is the price trending upwards or downwards? Is it consolidating within a range? Are there strong support or resistance levels nearby? The live Bid and Ask prices are always shown relative to these chart patterns. For instance, if EUR/USD is approaching a major resistance level on your hourly chart, you'd watch the live quotes particularly closely for signs of rejection or a breakthrough. Integrating chart analysis with your quote board observation helps you understand why the numbers are moving and where they might be headed next. It's the difference between just seeing the waves and understanding the tide.
Developing Your Quote Reading Practice
Like any skill, becoming proficient at reading the quote board takes practice and a systematic approach. It's not about being the fastest; it's about being accurate and understanding the implications of what you see. Here are some steps to build your confidence and refine your interpretation skills.
Start by dedicating specific time, perhaps 15-30 minutes daily, just to observe the quote board without placing trades. Pick a liquid currency pair, like EUR/USD or GBP/USD, during its peak trading hours (for EUR/USD, that's typically during the London and New York overlaps). Watch how the bid and ask prices move, how the spread changes, and how quickly these numbers update. Pay attention to how they react around whole numbers (e.g., 1.1000) or half-figures (1.1050), as these often act as psychological levels.
Next, connect your observations to a real-time chart. See how the numbers on the quote board translate to candlesticks or bars on your chart. Notice if there's any lag. When a new candlestick forms, observe the opening, high, low, and closing prices relative to the bid and ask you were seeing. This helps you internalise the relationship between the raw data and its visual representation. In practice, the desk will ask twice to confirm a large order, so being decisive and understanding the quote helps you communicate clearly.
Finally, use your broker's demo account to practice placing market and limit orders and observe their fills. This isn't about profit or loss; it's about seeing how your orders interact with the live quotes. Note any slippage on market orders or whether your limit orders are filled precisely. This hands-on experience, coupled with observation, will solidify your understanding and turn those once-confusing numbers into clear, actionable information for your trading decisions.
Avoiding Common Pitfalls in Quote Interpretation
Even with a solid grasp of bid, ask, and spread, traders can fall into common traps that lead to suboptimal outcomes. Being aware of these pitfalls is just as important as knowing the mechanics of the quote board itself. Forewarned is forearmed, and a little caution can save you from unnecessary frustration.
One significant pitfall is underestimating the impact of slippage. While you might see a fantastic entry price on your screen, a fast-moving market can mean your market order gets filled at a slightly worse price. This happens more frequently during periods of high volatility or when trading less liquid assets. Don't assume the price you click is the price you'll always get, especially with market orders. Always factor potential slippage into your risk calculations, particularly for stop-loss orders which, if executed via market order, can 'slip' past your intended stop price during rapid market moves.
Another trap is neglecting the overnight spread widening. Many traders focus on spreads during active daytime trading hours, but forget that spreads often widen significantly when markets are thin, such as late at night or over weekends. Holding positions overnight can incur a much larger effective transaction cost if you need to exit during these illiquid periods. This is particularly relevant if you're using very tight stop-losses.
Finally, never mistake the simplicity of a quote board for simplicity in trading. The numbers are clear, but the forces driving them are complex. Don't rely solely on the bid/ask display without considering chart context, economic news, or your overall trading plan. The quote board is a tool, not a crystal ball. Use it wisely, in conjunction with other analysis, to make well-rounded decisions. Over-reliance on just the immediate quote without broader context is a recipe for guessing, which is precisely what we're trying to avoid.
Read the primary source
Check it at the regulator, not at us
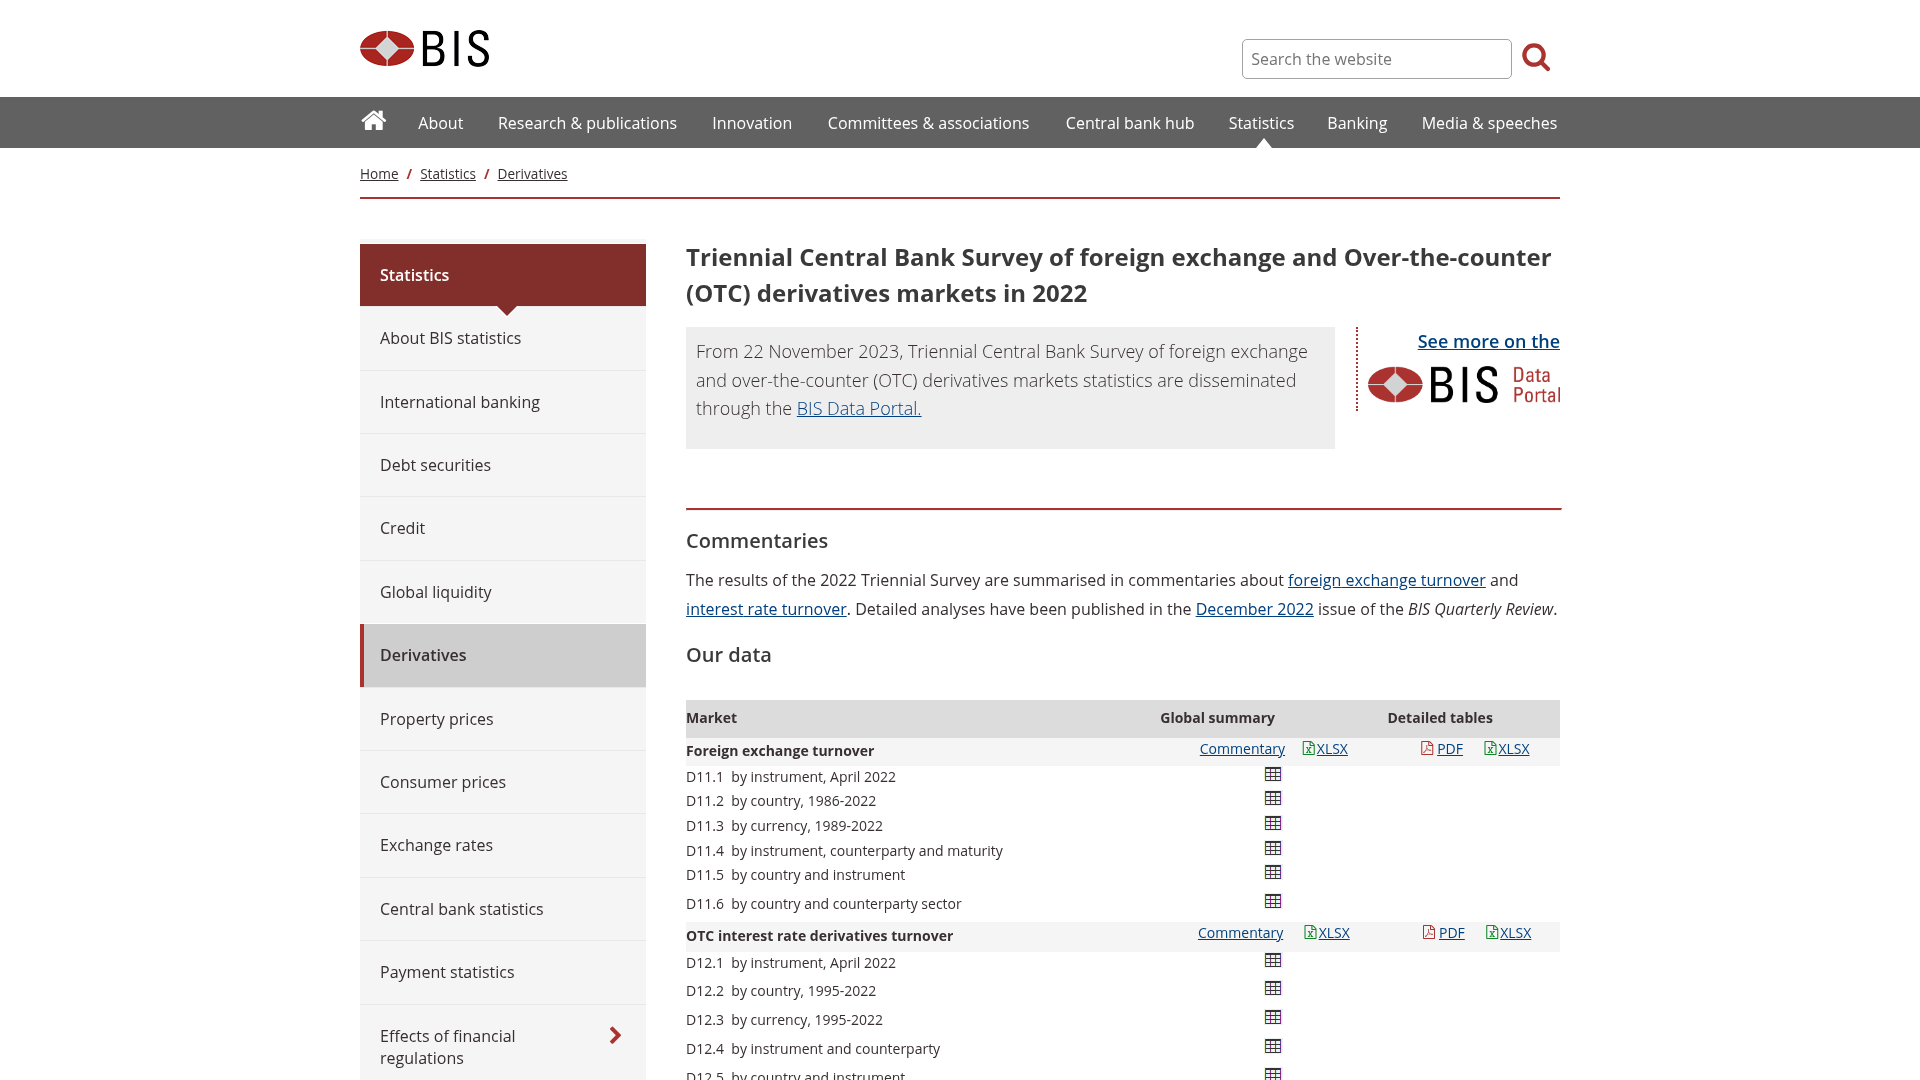
Screenshots of the official pages behind the rules in this guide. Open them yourself — the regulator’s own words always beat a summary of them.
Frequently asked
Sources
Where this came from
Written by Elena Marsh
Lead Instructor. We write structured, plain-English forex education for people learning from scratch. Understanding first, always — and never financial advice. The course itself lives in the curriculum.
Keep learning
Where this guide leads next
The guides closest to this one, in the order they build on it. Each is a full read on its own, and none of them assume you finished this page.
- Why Your Market Order Might Fill at a Price You Never SawDiscover the hidden mechanics behind market order execution, from order book dynamics to broker models, explaining why your fill…
- Unpacking the True Cost: Converting Pip Spreads into Your Trading DollarsUnderstanding the real monetary value of a pip spread is crucial, turning abstract numbers into the tangible cost of your forex and…
- When Your Stop Loss Gets Tagged: How Widening Spreads Can Catch You Off GuardMany traders mistakenly believe their stop loss is safe until the displayed price reaches it, but a sudden widening of the bid-ask…
- Line, Bar, and Candlestick Charts: Choosing Your Window to the MarketUnderstanding how price is visualized is fundamental; this guide breaks down line, bar, and candlestick charts to help you pick the…
- The Instant After You Click: Inside Your Trade's JourneyThat split-second between hitting 'buy' and seeing your position open is a flurry of complex processes. Understand what truly…