คู่มือ · 13 นาทีในการอ่าน · 2,512 words
ระบบเทรดของคุณทำผลงานได้ดีเฉพาะบางช่วงเวลาหรือไม่? นี่คือวิธีที่คุณจะรู้ได้
เทรดเดอร์หลายคนพบว่ากลยุทธ์ของพวกเขาทำผลงานได้อย่างยอดเยี่ยมในบางครั้ง แต่กลับล้มเหลวในเวลาอื่น จังหวะของตลาดต่างหาก ไม่ใช่ทักษะของคุณ อาจเป็นปัจจัยที่มองไม่เห็นเบื้องหลังผลลัพธ์ที่ไม่สอดคล้องกัน
ประเด็นสำคัญ
- สภาวะตลาด รวมถึงสภาพคล่อง ความผันผวน และกิจกรรมของผู้เข้าร่วมตลาด แตกต่างกันอย่างมากในแต่ละช่วงเวลาการเทรดทั่วโลก
- กลยุทธ์การเทรดของคุณอาจถูกปรับให้เหมาะสมโดยไม่ตั้งใจสำหรับลักษณะเฉพาะของช่วงเวลาตลาดบางช่วง ซึ่งนำไปสู่ประสิทธิภาพที่ไม่สอดคล้องกัน
- การติดตามและวิเคราะห์ประสิทธิภาพการเทรดของคุณตามช่วงเวลาการเทรดจริง เป็นขั้นตอนที่สำคัญแต่ถูกมองข้ามบ่อยครั้งในการตรวจสอบกลยุทธ์
- ตัวชี้วัดง่ายๆ เช่น อัตราการชนะ และกำไร/ขาดทุนเฉลี่ย ที่แยกตามช่วงเวลาตลาด สามารถเผยให้เห็นอคติที่ซ่อนอยู่ในประสิทธิภาพของกลยุทธ์ของคุณ
- การปรับเปลี่ยนเวลาการเทรดของคุณ หรือปรับปรุงกลยุทธ์ของคุณให้สอดคล้องกับพลวัตของช่วงเวลาตลาดที่แตกต่างกัน สามารถปรับปรุงผลลัพธ์โดยรวมได้อย่างมาก
- การละเลยประสิทธิภาพเฉพาะช่วงเวลา สามารถนำไปสู่ความมั่นใจที่ผิดพลาดในช่วงเวลาที่ดี หรือความหงุดหงิดที่ไม่จำเป็นในช่วงเวลาที่แย่
ปัญหาการทำงานหนักจนดึกดื่นของเทรดเดอร์
ลองจินตนาการดู: คุณมีช่วงเวลาที่ยอดเยี่ยม ทำกำไรได้หลาย pip ตั้งแต่ 9 AM ถึง 1 PM ตามเวลา New York ทุกอย่างดูถูกต้อง จุดเข้าแม่นยำ จุดออกคมกริบ แต่แล้วเมื่อคุณลองใช้ระบบเทรดเดิมในเวลาต่อมาของวัน หรืออาจจะเป็นช่วงเวลาตลาดเอเชีย ทันใดนั้นก็ไม่มีอะไรได้ผลเลย คุณพลาดจุดเข้า โดน stop loss และตลาดดูเหมือนจะเคลื่อนไหวสวนทางกับคุณอย่างแม่นยำน่าประหลาดใจ มันน่าหงุดหงิดใช่ไหม? มันสามารถทำให้คุณตั้งคำถามกับทักษะ กลยุทธ์ และแม้กระทั่งสติของคุณได้
นี่ไม่ใช่แค่สถานการณ์สมมติ แต่เป็นประสบการณ์ทั่วไปสำหรับเทรดเดอร์หลายคน ตลาดไม่ใช่สิ่งที่ไม่เปลี่ยนแปลง มันหายใจ มันหลับ มันตื่น และลักษณะของมันก็เปลี่ยนไปตลอดวงจร 24 ชั่วโมง สิ่งที่ได้ผลอย่างยอดเยี่ยมเมื่อตลาดคึกคักไปด้วยคำสั่งจากสถาบัน อาจไม่มีประสิทธิภาพเลยเมื่อสภาพคล่องเบาบางและการเคลื่อนไหวผันผวน
แก่นของปัญหาบ่อยครั้งไม่ได้อยู่ที่ข้อบกพร่องพื้นฐานของกลยุทธ์ของคุณ แต่เป็นความเหมาะสมกับสภาวะตลาดเฉพาะที่เกิดขึ้นในช่วงเวลาหนึ่งๆ ลองนึกภาพเหมือนรถสปอร์ตที่ได้รับการปรับแต่งมาอย่างดี: มันทำผลงานได้อย่างยอดเยี่ยมบนสนามแข่งที่เรียบและเปิดโล่ง แต่ไม่ใช่ตัวเลือกที่ดีที่สุดสำหรับถนนในเมืองที่ขรุขระและแออัด ระบบเทรดของคุณ ไม่ว่าจะดีแค่ไหน ก็อาจเป็นเหมือนรถสปอร์ตที่พยายามขับผ่านช่วงเวลาเร่งด่วน
อะไรที่ทำให้ช่วงเวลาการเทรดแต่ละช่วงแตกต่างกัน?
ตลาดแลกเปลี่ยนเงินตราต่างประเทศทั่วโลกเปิดทำการ 24 ชั่วโมงต่อวัน ห้าวันต่อสัปดาห์ แต่ไม่ได้มีการเคลื่อนไหวที่สม่ำเสมอตลอดเวลา แต่กลับมีช่วงเวลาที่แตกต่างกัน ซึ่งขับเคลื่อนโดยการเปิดและปิดของศูนย์กลางทางการเงินหลักทั่วโลก ช่วงเวลาเหล่านี้คือสิ่งที่เราเรียกว่าช่วงเวลาการเทรด และแต่ละช่วงก็มีลักษณะเฉพาะตัว ซึ่งส่วนใหญ่ถูกกำหนดโดยผู้เข้าร่วมตลาดที่เคลื่อนไหวในช่วงเวลานั้นๆ
ประการแรกคือ สภาพคล่อง (liquidity) ซึ่งหมายถึงความง่ายในการซื้อหรือขายสินทรัพย์โดยไม่ส่งผลกระทบต่อราคา ในช่วงเวลาที่มีการซื้อขายสูงสุด เมื่อธนาคาร กองทุนเฮดจ์ฟันด์ และเทรดเดอร์รายย่อยจำนวนมากกำลังเคลื่อนไหว สภาพคล่องจะสูง ซึ่งหมายถึงสเปรดที่แคบลง slippage น้อยลง และการเคลื่อนไหวของราคาที่ราบรื่นขึ้นโดยทั่วไป ช่วงเวลาที่เงียบสงบจะเห็นสภาพคล่องลดลง ซึ่งนำไปสู่สเปรดที่กว้างขึ้น และการเคลื่อนไหวที่ผันผวนและคาดเดาได้ยากขึ้น
จากนั้นคือ ความผันผวน (volatility) ซึ่งวัดขนาดของการผันผวนของราคา ความผันผวนมักจะสูงขึ้นเมื่อมีการประกาศข่าวเศรษฐกิจสำคัญ หรือเมื่อมีผู้เข้าร่วมตลาดจำนวนมากกำลังซื้อขายอย่างกระตือรือร้น ซึ่งมักจะเกิดขึ้นในช่วงเวลาที่สองช่วงตลาดหลักทับซ้อนกัน ช่วงเวลาตลาดที่แตกต่างกันยังดึงดูดผู้เข้าร่วมตลาดประเภทต่างๆ ตัวอย่างเช่น ช่วงเวลาตลาดเอเชียอาจเห็นกิจกรรมจากสถาบันจากญี่ปุ่นและจีนมากขึ้น ในขณะที่ช่วงเวลาตลาดลอนดอนนำธนาคารยุโรปเข้ามา และช่วงเวลาตลาดนิวยอร์กเพิ่มผู้เล่นจากอเมริกาเหนือ แต่ละกลุ่มมีลำดับความสำคัญและรูปแบบการเทรดของตนเอง ซึ่งกำหนดพฤติกรรมของตลาดต่อไป ประเภทและผลกระทบของการประกาศข่าวก็แตกต่างกันอย่างมากเช่นกัน ตัวอย่างเช่น ข้อมูลการจ้างงานของสหรัฐฯ (เช่น Non-Farm Payrolls จาก US Bureau of Labor Statistics) จะมีผลกระทบมากกว่ามากในช่วงเวลาตลาดนิวยอร์กมากกว่าในช่วงเวลาโตเกียว
สามช่วงเวลาตลาดหลัก: โตเกียว ลอนดอน และนิวยอร์ก
แม้ว่าจะมีศูนย์กลางทางการเงินมากมาย แต่ตลาดโดยทั่วไปจะหมุนรอบสามช่วงเวลาตลาดหลัก: โตเกียว (เป็นตัวแทนของเอเชีย) ลอนดอน (ยุโรป) และนิวยอร์ก (อเมริกาเหนือ) การทำความเข้าใจลักษณะทั่วไปของช่วงเวลาเหล่านี้คือขั้นตอนแรกในการระบุว่าระบบเทรดของคุณมีอคติทางเวลาหรือไม่
ช่วงเวลาตลาดโตเกียว (ประมาณ 12 AM – 9 AM GMT) มักมีลักษณะเด่นคือสภาพคล่องต่ำกว่าและกรอบราคาแคบกว่า โดยเฉพาะสำหรับคู่สกุลเงินที่ไม่ใช่ของเอเชีย เป็นช่วงเวลาที่ดีสำหรับกลยุทธ์แบบ Sideways (Range-bound) หรือการเทรด Breakout ในคู่สกุลเงินเอเชีย เช่น USD/JPY หรือ AUD/JPY อย่างไรก็ตาม สำหรับคู่สกุลเงินอย่าง EUR/USD การเคลื่อนไหวอาจไม่ยั่งยืนเท่า BIS Triennial Central Bank Survey of FX turnover ให้ข้อมูลที่ยอดเยี่ยมเกี่ยวกับกิจกรรมในภูมิภาค ซึ่งแสดงให้เห็นอย่างสม่ำเสมอว่าโตเกียวเป็นศูนย์กลางที่สำคัญแต่มีสภาพคล่องน้อยกว่าเมื่อเทียบกับลอนดอนหรือนิวยอร์ก
ช่วงเวลาตลาดลอนดอน (ประมาณ 8 AM – 5 PM GMT) ได้รับการพิจารณาอย่างกว้างขวางว่าเป็นช่วงเวลาตลาดที่มีการเคลื่อนไหวและสภาพคล่องสูงที่สุด มันทับซ้อนกับช่วงท้ายของช่วงเวลาตลาดเอเชียและช่วงเริ่มต้นของช่วงเวลาตลาดนิวยอร์ก ซึ่งนำไปสู่ความผันผวนสูงและปริมาณการซื้อขายที่สำคัญ แนวโน้มหลักหลายอย่างเริ่มต้นหรือเร่งตัวขึ้นในช่วงเวลาเหล่านี้ สเปรดมักจะแคบที่สุด และสถาบันขนาดใหญ่มีการเคลื่อนไหวอย่างมาก BIS report on foreign exchange market structure ให้รายละเอียดว่าลอนดอนยังคงเป็นศูนย์กลาง FX ที่ใหญ่ที่สุดในโลกได้อย่างไร
ช่วงเวลาตลาดนิวยอร์ก (ประมาณ 1 PM – 10 PM GMT) ทับซ้อนกับลอนดอนอย่างมาก โดยเฉพาะในช่วงเริ่มต้น ซึ่งมีส่วนทำให้เกิดช่วงเวลาที่มีสภาพคล่องและความผันผวนสูงสุดของวัน เมื่อเทรดเดอร์ในลอนดอนเริ่มลดกิจกรรมลง ช่วงเวลาตลาดนิวยอร์กสามารถเห็นแนวโน้มที่ต่อเนื่องหรือการกลับตัว โดยเฉพาะอย่างยิ่งเมื่อมีการประกาศข้อมูลเศรษฐกิจสำคัญของสหรัฐฯ ช่วงหลังของช่วงเวลาตลาดนิวยอร์ก หลังจากตลาดในยุโรปปิดทำการ มักจะเห็นความผันผวนและปริมาณลดลง ทำให้คล้ายกับช่วงเวลาตลาดโตเกียวมากขึ้น
ลักษณะสำคัญของช่วงเวลาการเทรดหลักทั่วโลก
| ช่วงเวลาตลาด | เวลาทำการโดยทั่วไป (GMT) | ผู้เข้าร่วมตลาดหลัก | ความผันผวน | สภาพคล่อง |
|---|---|---|---|---|
| โตเกียว | 00:00 น. ถึง 09:00 น. | ธนาคารในเอเชีย, ผู้ส่งออกญี่ปุ่น | ปานกลาง, มักจะเคลื่อนไหวในกรอบ | ปานกลาง (สูงสำหรับคู่สกุลเงิน JPY) |
| ลอนดอน | 08:00 น. - 17:00 น. | ธนาคารในยุโรป, กองทุนสถาบัน | สูง, มีแนวโน้มที่จะเกิดเทรนด์ | สูงที่สุด |
| นิวยอร์ก | 13:00 น. - 22:00 น. | สถาบันในอเมริกาเหนือ, เทรดเดอร์รายย่อย | สูง (โดยเฉพาะช่วงต้น), ปานกลาง (ช่วงปลาย) | สูง (โดยเฉพาะช่วงต้น), ปานกลาง (ช่วงปลาย) |
เริ่มต้นงานนักสืบของคุณ: การบันทึกข้อมูลเบื้องต้น
ขั้นตอนแรกในการทำความเข้าใจว่ากลยุทธ์ของคุณมีอคติ (bias) ตามช่วงเวลาตลาดหรือไม่ คือการรวบรวมข้อมูลที่ถูกต้อง นี่ไม่ใช่งานที่น่าตื่นเต้น แต่เป็นรากฐานที่สำคัญ คุณจำเป็นต้องบันทึกการเทรดของคุณอย่างละเอียดถี่ถ้วน นอกเหนือจากแค่ราคาเข้า/ออก และกำไร/ขาดทุน ข้อมูลสำคัญในที่นี้คือเวลาที่แน่นอนที่คุณเข้าและออกจากเทรด พร้อมกับช่วงเวลาตลาด (trading session) ที่เกี่ยวข้อง
สำหรับการเทรดแต่ละครั้ง ไม่ว่าคุณจะใช้สมุดบันทึกการเทรด (trading journal) หรือสเปรดชีตธรรมดา ให้แน่ใจว่าได้บันทึกสิ่งเหล่านี้: เวลาเข้าเทรด (วันและเวลา), เวลาออกเทรด (วันและเวลา), คู่สกุลเงินที่เทรด (เช่น EUR/USD), ทิศทาง (ซื้อ/ขาย), ราคาเข้า, ราคาออก, Stop Loss, Take Profit, ผลลัพธ์ (กำไร/ขาดทุนเป็น pips และสกุลเงิน), และที่สำคัญที่สุดคือ ช่วงเวลาตลาดหลัก (Dominant Trading Session) ที่เริ่มเทรด คุณสามารถกำหนดช่วงเวลาตลาดหลักได้โดยการตรวจสอบว่าตลาดหลักใด (โตเกียว ลอนดอน นิวยอร์ก) มีความเคลื่อนไหวมากที่สุดในช่วงเวลาที่คุณเข้าเทรด หากเป็นช่วงเวลาที่ทับซ้อนกัน ก็ให้บันทึกไว้ด้วย
แม้ว่าแพลตฟอร์มการเทรดส่วนใหญ่จะบันทึกเวลาที่แน่นอน (timestamps) ไว้ แต่การจัดหมวดหมู่ตามช่วงเวลาตลาดด้วยตนเองจะช่วยให้คุณเข้าใจได้ลึกซึ้งยิ่งขึ้น ตัวอย่างเช่น หากคุณใช้ MetaTrader 4 หรือ 5 คุณสามารถส่งออกประวัติบัญชีของคุณไปยังสเปรดชีต ซึ่งจะให้เวลาเข้าและออกที่แม่นยำถึงระดับวินาที จากนั้น สูตรง่ายๆ สามารถกำหนดช่วงเวลาตลาดได้โดยอิงจาก GMT หรือเวลาท้องถิ่นของคุณที่แปลงเป็น GMT สิ่งนี้อาจฟังดูน่าเบื่อ แต่เป็นข้อมูลดิบสำหรับข้อมูลเชิงลึกที่แท้จริง
การวิเคราะห์แบบง่าย: อัตราการชนะและค่าเฉลี่ยการเทรดตามช่วงเวลาตลาด
เมื่อคุณมีจำนวนตัวอย่างการเทรดที่เหมาะสมแล้ว (ตั้งเป้าหมายอย่างน้อย 30-50 เทรดต่อช่วงเวลาตลาดที่คุณต้องการวิเคราะห์เพื่อดูแนวคิดคร่าวๆ แม้ว่ายิ่งมากยิ่งดี) คุณก็สามารถเริ่มคำนวณตัวเลขได้ เริ่มต้นด้วยสองตัวชี้วัดที่ตรงไปตรงมา: อัตราการชนะ (win rate) และกำไรหรือขาดทุนเฉลี่ยต่อการเทรดของคุณ โดยแยกตามช่วงเวลาตลาด
ตัวอย่างเช่น ในการคำนวณ อัตราการชนะ (win rate) สำหรับช่วงเวลาตลาดลอนดอน เพียงแค่นับจำนวนเทรดที่ชนะในช่วงเวลาทำการของลอนดอน แล้วหารด้วยจำนวนเทรดทั้งหมดที่เกิดขึ้นในช่วงเวลาทำการของลอนดอน จากนั้นคูณด้วย 100 เพื่อให้ได้เป็นเปอร์เซ็นต์ ทำเช่นนี้สำหรับแต่ละช่วงเวลาตลาด คุณอาจพบความแตกต่างที่ชัดเจน: เช่น อัตราการชนะ 65% ในลอนดอน แต่เพียง 35% ในโตเกียว สิ่งนี้จะบ่งชี้ถึงปัญหาที่อาจเกิดขึ้นได้ทันที
ถัดไป ให้คำนวณ กำไร/ขาดทุนเฉลี่ยต่อการเทรด สำหรับแต่ละช่วงเวลาตลาด รวมกำไรและขาดทุนทั้งหมด (เป็น pips หรือสกุลเงิน) สำหรับการเทรดที่เริ่มขึ้นภายในช่วงเวลาตลาดที่กำหนด แล้วหารด้วยจำนวนเทรดทั้งหมดสำหรับช่วงเวลาตลาดนั้น ตัวชี้วัดนี้บอกคุณไม่เพียงแค่ว่าคุณชนะบ่อยแค่ไหน แต่ยังบอกด้วยว่าคุณชนะหรือแพ้ มากน้อยเพียงใด โดยเฉลี่ย อัตราการชนะที่สูงแต่มีกำไรเฉลี่ยเล็กน้อย อาจไม่เป็นที่ต้องการเท่าอัตราการชนะที่ต่ำกว่าแต่มีกำไรเฉลี่ยที่สูงกว่ามาก ขึ้นอยู่กับการบริหารความเสี่ยงของคุณ ความแตกต่างที่ชัดเจนในจุดนี้อาจเป็นสัญญาณที่แข็งแกร่งว่าความได้เปรียบ (edge) ของกลยุทธ์ของคุณขึ้นอยู่กับช่วงเวลาตลาด การวิเคราะห์พื้นฐานประเภทนี้ช่วยให้คุณเห็นรูปแบบที่คุณอาจเคยรู้สึกคลุมเครือมาก่อน เปลี่ยนสัญชาตญาณให้เป็นข้อมูลที่นำไปปฏิบัติได้
หากผลลัพธ์การเทรดของคุณรู้สึกเหมือนรถไฟเหาะ ที่พุ่งขึ้นสูงสุดในบางช่วงเวลาและดิ่งลงในเวลาอื่น คุณอาจกำลังเห็นจังหวะของตลาดส่งผลต่อกลยุทธ์ของคุณมากกว่าที่คุณตระหนัก
เหนือกว่าพื้นฐาน: ตัวชี้วัดที่ปรับตามความเสี่ยงเพื่อข้อมูลเชิงลึกที่ลึกซึ้งยิ่งขึ้น
แม้ว่าอัตราการชนะและกำไร/ขาดทุนเฉลี่ยจะเป็นจุดเริ่มต้นที่ดี แต่การทำความเข้าใจประสิทธิภาพของกลยุทธ์ของคุณตามช่วงเวลาตลาดอย่างแท้จริงนั้นจำเป็นต้องพิจารณาตัวชี้วัดที่ปรับตามความเสี่ยง (risk-adjusted metrics) มาตรการเหล่านี้ให้มุมมองที่ละเอียดอ่อนยิ่งขึ้น โดยคำนึงถึงขนาดของกำไรเมื่อเทียบกับขาดทุน ซึ่งเป็นสิ่งสำคัญสำหรับการทำกำไรในระยะยาว
ตัวชี้วัดที่ทรงพลังอย่างหนึ่งคือ R-multiple (หรือ Risk Multiple) หากคุณเสี่ยง $100 ต่อการเทรด (ซึ่งคือ '1R' ของคุณ) และคุณทำกำไรได้ $200 นั่นคือการชนะ 2R หากคุณขาดทุน $50 นั่นคือการขาดทุน 0.5R การคำนวณ R-multiple เฉลี่ยสำหรับแต่ละช่วงเวลาตลาดช่วยให้คุณเห็นไม่เพียงแค่ว่าคุณกำลังชนะหรือไม่ แต่ยังเห็น ประสิทธิภาพ ในการบริหารความเสี่ยงและการทำกำไรเมื่อเทียบกับความเสี่ยงนั้น ช่วงเวลาตลาดที่คุณมี R-multiple เฉลี่ย 1.5 นั้นดีกว่าช่วงเวลาตลาดที่มี R-multiple 0.5 อย่างมีนัยสำคัญ แม้ว่าอัตราการชนะจะใกล้เคียงกันก็ตาม
ตัวชี้วัดที่ยอดเยี่ยมอีกอย่างคือ Profit Factor สิ่งนี้คำนวณโดยการนำกำไรสุทธิรวมของคุณหารด้วยขาดทุนสุทธิรวมของคุณ (ไม่รวมค่าคอมมิชชั่น) Profit Factor ที่ 2.0 หมายความว่าคุณกำลังทำกำไรได้เป็นสองเท่าของที่คุณขาดทุน ตัวเลขเดียวนี้ให้ข้อบ่งชี้ที่ทรงพลังถึงความสามารถในการทำกำไรโดยรวมของกลยุทธ์ของคุณ ด้วยการคำนวณ Profit Factor สำหรับแต่ละช่วงเวลาตลาด คุณสามารถระบุได้อย่างแม่นยำว่ากลยุทธ์ของคุณมีประสิทธิภาพมากที่สุดที่ใด และอาจกำลังสูญเสียเงินทุนที่ใด ตัวอย่างเช่น คุณอาจพบช่วงเวลาตลาดที่อัตราการชนะของคุณอยู่ในระดับที่ดี แต่การขาดทุนเฉลี่ยของคุณมีขนาดใหญ่เกินสัดส่วน ทำให้ Profit Factor ของคุณลดลงอย่างมาก ตัวชี้วัดเหล่านี้เป็นพื้นฐานสำหรับการทบทวนประสิทธิภาพอย่างจริงจัง
ประสิทธิภาพการเทรดสมมติที่เปรียบเทียบตามช่วงเวลาตลาด
| ช่วงเวลา | จำนวนการเทรด | อัตราการชนะ (%) | R-Multiple เฉลี่ย | Profit Factor |
|---|---|---|---|---|
| โตเกียว | 60 | 45% | 0.7 | 0.9 |
| ลอนดอน | 110 | 58% | 1.2 | 1.8 |
| นิวยอร์ก | 90 | 52% | 0.9 | 1.3 |
ระบุ 'ทำไม': สาเหตุที่เป็นไปได้ของความแตกต่างด้านประสิทธิภาพ
เมื่อคุณระบุได้ถึงความลำเอียงของช่วงเวลา (session bias) ที่มีผลต่อประสิทธิภาพการเทรดของคุณแล้ว คำถามต่อไปที่เกิดขึ้นตามธรรมชาติคือ: ทำไมถึงเป็นเช่นนั้น? การทำความเข้าใจถึงสาเหตุที่แท้จริงเป็นสิ่งสำคัญอย่างยิ่งในการตัดสินใจว่าจะปรับตัวอย่างไร โดยปกติแล้วไม่ใช่เพียงปัจจัยเดียว แต่เป็นผลรวมของสภาวะตลาดและพฤติกรรมของคุณเอง
ความผันผวนและสภาพคล่องของตลาด: ดังที่ได้กล่าวไปแล้ว ช่วงเวลาการซื้อขายแต่ละช่วงมีความเคลื่อนไหวที่แตกต่างกัน กลยุทธ์การเทรดตามแนวโน้ม (trend-following strategy) อาจประสบความสำเร็จได้ดีในช่วงเวลาที่ตลาดลอนดอนมีความผันผวนสูงและมีการทับซ้อนกัน แต่กลับประสบปัญหาในช่วงตลาดโตเกียวที่เคลื่อนไหวในกรอบแคบ (range-bound) ในขณะเดียวกัน กลยุทธ์การเทรดแบบ scalping ที่อาศัย spread แคบๆ อาจไม่ทำกำไรในช่วงเวลาที่สภาพคล่องต่ำและ spread กว้างขึ้น การประกาศข่าวสำคัญ เช่น จากธนาคารกลางสหรัฐฯ (Federal Reserve) หรือธนาคารกลางยุโรป (European Central Bank) สร้างความผันผวนอย่างรุนแรงฉับพลัน ซึ่งสามารถสร้างหรือทำลายโอกาสในการเทรดระยะสั้นได้ คุณต้องพิจารณาว่ากลยุทธ์ของคุณพึ่งพิงความผันผวนสูงหรือต่ำโดยเนื้อแท้หรือไม่
พฤติกรรมของผู้เข้าร่วมตลาด: ผู้ที่กำลังเคลื่อนไหวอยู่ในตลาดสามารถเปลี่ยนแปลงลักษณะของตลาดได้ ในช่วงเวลาที่ตลาดเงียบสงบ อาจมีผู้เล่นสถาบันน้อยลง ทำให้การเคลื่อนไหวของราคาไม่สม่ำเสมอและมีโอกาสถูกปั่นราคาได้ง่ายขึ้น หรือเพียงแค่รูปแบบทางเทคนิคที่เชื่อถือได้น้อยลง ในช่วงเวลาที่ตลาดทับซ้อนกัน กิจกรรมของสถาบันสามารถสร้างโมเมนตัมที่ยั่งยืนได้ นอกจากนี้ ให้พิจารณาปัจจัยภายในของคุณเองด้วย คุณรู้สึกเหนื่อยล้าหรือไม่เมื่อเทรดในช่วงตลาดเอเชียตอนดึก? คุณมีสมาธิดีขึ้นในช่วงเวลากลางวันตามเวลาท้องถิ่นของคุณหรือไม่? บางครั้ง 'ทำไม' อาจเกี่ยวกับสภาพร่างกายและจิตใจของคุณมากกว่าสภาพตลาด
สเปรด (Spread) และการดำเนินการคำสั่ง (Execution) ของโบรกเกอร์: แม้ว่าเราจะไม่สามารถอ้างอิงสเปรดของโบรกเกอร์เฉพาะรายอย่าง Pepperstone หรือ XM ได้ แต่เป็นที่ทราบกันดีในกลไกตลาดว่าสเปรดสามารถกว้างขึ้นอย่างมีนัยสำคัญในช่วงเวลาที่สภาพคล่องต่ำ หรือในช่วงที่มีข่าวสำคัญ สิ่งนี้ส่งผลกระทบโดยตรงต่อความสามารถในการทำกำไรของคุณ โดยเฉพาะอย่างยิ่งสำหรับนักเทรดแบบ scalper หรือนักเทรดระยะสั้น กลยุทธ์ที่สมเหตุสมผลด้วย spread 0.5 pip สำหรับคู่ EUR/USD อาจกลายเป็นไม่ทำกำไรหาก spread กว้างขึ้นเป็น 2 pips ในช่วงนอกเวลาทำการ ซึ่งจะลดทอนอัตรากำไรที่เป็นไปได้ของคุณ โปรดตระหนักเสมอว่าพฤติกรรม spread โดยทั่วไปของโบรกเกอร์ของคุณมีความสัมพันธ์กับช่วงเวลาการซื้อขายต่างๆ อย่างไร
การปรับกลยุทธ์ของคุณให้เข้ากับตารางเวลาของตลาด
การค้นพบว่ากลยุทธ์ของคุณมีประสิทธิภาพไม่ดีในช่วงเวลาการซื้อขายบางช่วง ไม่ได้หมายความว่ากลยุทธ์ของคุณเสียหาย แต่หมายความว่าคุณจำเป็นต้องปรับตัว คุณมีทางเลือกอยู่ไม่กี่ทาง และทางเลือกที่ดีที่สุดขึ้นอยู่กับสถานการณ์ส่วนตัวของคุณและระดับความแตกต่างของประสิทธิภาพ
ทางเลือกที่ 1: หลีกเลี่ยงช่วงเวลาที่มีปัญหาโดยสิ้นเชิง นี่มักเป็นวิธีแก้ปัญหาที่ง่ายที่สุดและมีประสิทธิภาพที่สุด หากกลยุทธ์ของคุณขาดทุนอย่างสม่ำเสมอหรือมีประสิทธิภาพแย่ลงอย่างเห็นได้ชัดในช่วงตลาดโตเกียว แล้วทำไมถึงต้องเทรดในช่วงนั้น? จงมุ่งเน้นพลังงานและเงินทุนของคุณไปที่ช่วงเวลาที่คุณมีข้อได้เปรียบที่ชัดเจน ตัวอย่างเช่น หากคุณพบว่ามีประสิทธิภาพที่ดีในช่วงตลาดลอนดอนและช่วงต้นตลาดนิวยอร์ก ก็เพียงแค่เน้นการเทรดของคุณในช่วงเวลาเหล่านั้น สิ่งนี้อาจเป็นเรื่องท้าทายหากช่วงเวลาเหล่านั้นไม่เหมาะกับตารางเวลาของคุณ แต่มันเป็นทางเลือกที่เป็นไปได้สำหรับหลายๆ คน
ทางเลือกที่ 2: ปรับเปลี่ยนกลยุทธ์ของคุณสำหรับช่วงเวลาเฉพาะ แทนที่จะหลีกเลี่ยง คุณสามารถพัฒนากฎหรือการปรับเปลี่ยนเฉพาะสำหรับช่วงเวลาที่มีประสิทธิภาพต่ำ ตัวอย่างเช่น หากคุณระบุได้ว่ากลยุทธ์การเทรดแบบ breakout ของคุณประสบปัญหาในช่วงตลาดเอเชียที่มีความผันผวนต่ำ คุณอาจปรับเป้าหมายกำไรให้เล็กลง หรือเทรดเฉพาะคู่สกุลเงินที่มักจะเคลื่อนไหวมากขึ้นในช่วงเวลาเหล่านั้น (เช่น JPY crosses) คุณยังสามารถขยายจุดตัดขาดทุน (stop loss) ของคุณเล็กน้อย หรือลดขนาดการเทรด (position size) เพื่อรองรับการเคลื่อนไหวของราคาที่ไม่ราบรื่น ลองพิจารณาเพิ่มตัวกรองความผันผวน (volatility filter) ที่เฉพาะเจาะจงสำหรับช่วงเวลานั้น ตัวอย่างเช่น หากค่า Average True Range (ATR) ต่ำกว่าเกณฑ์ที่กำหนดในช่วงตลาดโตเกียว คุณอาจงดเว้นจากการเข้าเทรดตามรูปแบบปกติของคุณ
ทางเลือกที่ 3: พัฒนากลยุทธ์ที่แยกต่างหาก สำหรับบางคน วิธีการที่แตกต่างออกไปโดยสิ้นเชิงอาจมีความจำเป็น หากกลยุทธ์หลักของคุณคือการเทรดตามแนวโน้ม (trend-following) คุณอาจพัฒนากลยุทธ์การเทรดแบบ range-trading ที่แตกต่างออกไปโดยเฉพาะสำหรับช่วงเวลาที่ตลาดเงียบสงบ สิ่งนี้ต้องใช้ความพยายามและการ backtesting มากขึ้น แต่จะช่วยให้คุณสามารถใช้ประโยชน์จากสภาวะตลาดที่ไม่เหมือนใครในแต่ละช่วงเวลาได้ หัวใจสำคัญคือการไม่บังคับใช้กลยุทธ์เดียวกับทุกสภาวะตลาด แต่เป็นการตระหนักว่าสภาพแวดล้อมที่แตกต่างกันต้องการเครื่องมือที่แตกต่างกัน
อันตรายของการปรับแต่งมากเกินไป (Curve Fitting)
เมื่อคุณเริ่มวิเคราะห์ข้อมูลช่วงเวลาซื้อขายและพิจารณาการปรับเปลี่ยน มีข้อผิดพลาดสำคัญที่ต้องระวังคือ: การปรับแต่งมากเกินไป หรือที่เรียกว่า curve fitting สิ่งนี้เกิดขึ้นเมื่อคุณปรับกลยุทธ์ของคุณให้เข้ากับข้อมูลในอดีตอย่างแม่นยำเกินไป รวมถึงผลการดำเนินงานของช่วงเวลาซื้อขายในอดีต ซึ่งทำให้มีโอกาสน้อยที่จะทำงานได้ดีในอนาคต
ลองนึกภาพการตัดชุดสูท: คุณต้องการให้มันพอดีตัว แต่ถ้าคุณตัดมันแน่นเกินไปจนใส่ได้เฉพาะตอนที่คุณยืนในท่าทางเฉพาะเจาะจง มันก็จะใช้งานจริงในชีวิตประจำวันไม่ได้ ในทำนองเดียวกัน หากคุณเพิ่มกฎเกณฑ์ ตัวกรอง และข้อยกเว้นมากเกินไป โดยอิงจากความผันผวนเล็กน้อยทุกครั้งในผลการดำเนินงานเฉพาะช่วงเวลาซื้อขายในอดีต กลยุทธ์ของคุณอาจกลายเป็นเรื่องซับซ้อนและเปราะบางเกินไป มันอาจดูยอดเยี่ยมบนกราฟย้อนหลัง แสดงผลกำไรที่น่าทึ่งในช่วงเวลาหนึ่ง แต่แล้วก็ล้มเหลวทันทีที่สภาวะตลาดเปลี่ยนแปลงไปเพียงเล็กน้อย
แทนที่จะพยายาม 'แก้ไข' ความคลาดเคลื่อนเล็กน้อยทุกอย่างในทุกช่วงเวลาซื้อขาย ให้มุ่งเน้นไปที่ช่องว่างด้านประสิทธิภาพที่สำคัญที่สุด หากการเทรดในช่วงเวลา London ของคุณทำกำไรได้อย่างชัดเจน และการเทรดในช่วงเวลา Tokyo ของคุณขาดทุนอย่างต่อเนื่อง นั่นคือสัญญาณที่ชัดเจน แต่ถ้าช่วงเวลาซื้อขายหนึ่งแสดงให้เห็นถึงการลดลงเล็กน้อยที่อาจเป็นเพียงสัญญาณรบกวนทางสถิติ ให้ต้านทานความต้องการที่จะสร้างชุดกฎที่ซับซ้อนเพียงเพื่อแก้ไขการลดลงเล็กน้อยนั้น รักษาการปรับเปลี่ยนของคุณให้สมเหตุสมผลและอิงจากรูปแบบที่ชัดเจนและเกิดขึ้นซ้ำ ๆ เป้าหมายคือกลยุทธ์ที่ยืดหยุ่น ไม่ใช่ความผิดปกติทางประวัติศาสตร์ที่ปรับแต่งมาอย่างสมบูรณ์แบบ
การทบทวนผลการดำเนินงานอย่างต่อเนื่องของคุณ: นี่ไม่ใช่การตรวจสอบครั้งเดียวแล้วจบไป
การทำความเข้าใจว่ากลยุทธ์ของคุณทำงานอย่างไรในแต่ละช่วงเวลาซื้อขายที่แตกต่างกันไม่ใช่ภารกิจที่ทำครั้งเดียวแล้วจบไป ตลาดมีการเปลี่ยนแปลงอยู่เสมอ และกลยุทธ์ของคุณ แม้จะยอดเยี่ยมเพียงใด ก็อาจเห็นความได้เปรียบของมันลดลงหรือเปลี่ยนแปลงไปตามกาลเวลา เช่นเดียวกับการที่คุณทบทวนผลการดำเนินงานการเทรดโดยรวมของคุณเป็นระยะ คุณก็ควรกลับมาทบทวนการวิเคราะห์เฉพาะช่วงเวลาซื้อขายของคุณอย่างสม่ำเสมอ
ตั้งเป้าที่จะทำการทบทวนผลการดำเนินงานเฉพาะช่วงเวลาซื้อขายอย่างละเอียดถี่ถ้วนอย่างน้อยไตรมาสละครั้ง หรือหลังจากมีการเปลี่ยนแปลงที่สำคัญในกลยุทธ์หรือสภาวะตลาดของคุณ สิ่งนี้ช่วยให้คุณสามารถจับอคติที่กำลังเกิดขึ้น หรือการหายไปของความได้เปรียบที่เคยเชื่อถือได้ ก่อนหน้านี้ รูปแบบสภาพคล่องสำหรับคู่สกุลเงินบางคู่ อาจมีการเปลี่ยนแปลง หรือการประกาศข้อมูลเศรษฐกิจใหม่ ๆ อาจเปลี่ยนแปลงลักษณะความผันผวนของช่วงเวลาซื้อขาย การเฝ้าระวังอย่างต่อเนื่องของคุณทำให้มั่นใจได้ว่าคุณจะเทรดด้วยความเข้าใจที่ทันสมัยและแม่นยำที่สุดเกี่ยวกับจุดแข็งและจุดอ่อนของกลยุทธ์ของคุณ
ด้วยการเฝ้าติดตามและปรับเปลี่ยนแนวทางของคุณอย่างสม่ำเสมอโดยอิงจากข้อมูลจริง คุณจะก้าวข้ามการคาดเดาและการเทรดด้วยอารมณ์ คุณจะเปลี่ยนเป็นนักเทรดที่ตั้งใจมากขึ้น ขับเคลื่อนด้วยข้อมูล ซึ่งเคารพจังหวะของตลาดที่เปลี่ยนแปลงอยู่เสมอ และปรับกลยุทธ์ของคุณให้สอดคล้องกัน ติดตาม วิเคราะห์ และปรับเปลี่ยนอยู่เสมอ นั่นคือเส้นทางสู่การพัฒนาอย่างต่อเนื่อง
อ่านแหล่งข้อมูลหลัก
ตรวจสอบได้ที่หน่วยงานกำกับดูแล ไม่ใช่ที่เรา
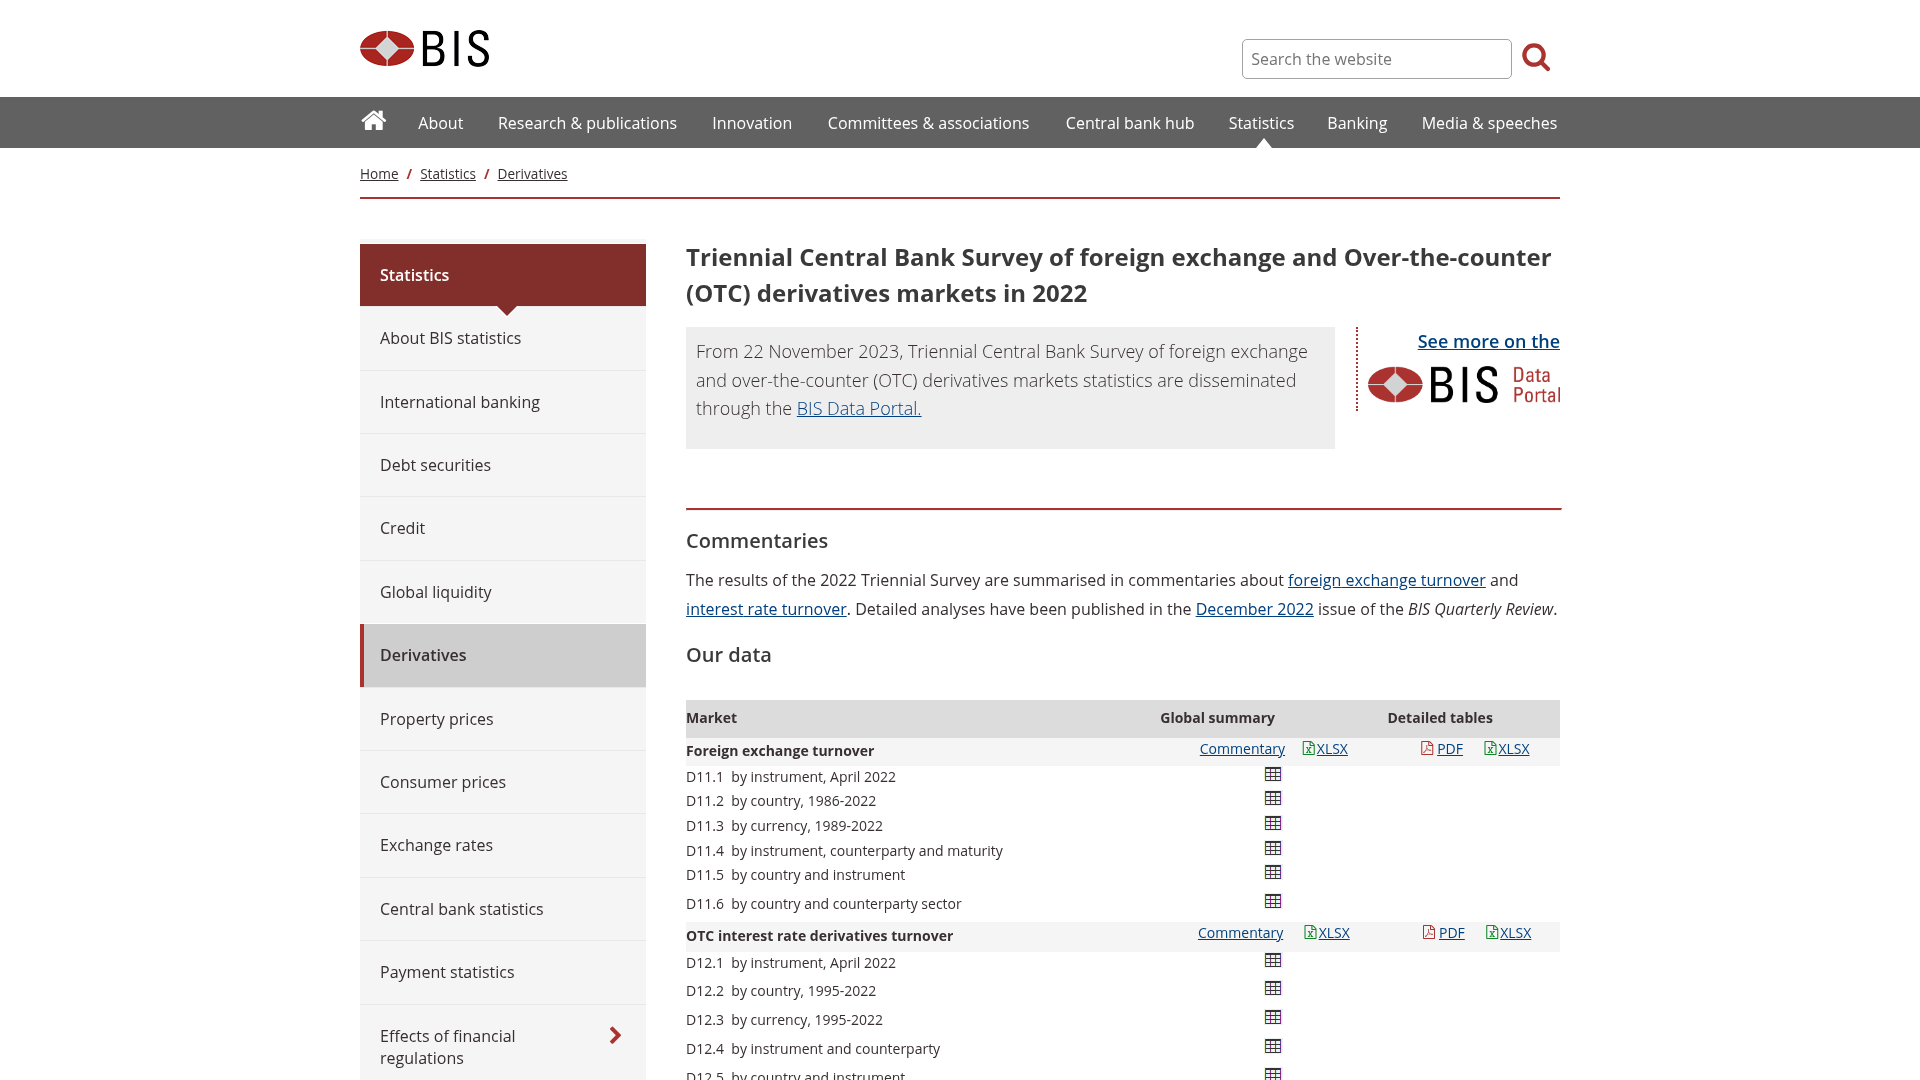
ภาพหน้าจอของหน้าเว็บทางการที่มาของกฎระเบียบในคู่มือนี้ เปิดดูด้วยตัวคุณเอง — คำพูดของหน่วยงานกำกับดูแลย่อมดีกว่าสรุปเสมอ
คำถามที่พบบ่อย
แหล่งที่มา
ที่มา
- BIS — Foreign exchange market structurebis.org
- BIS Triennial Central Bank Survey of FX turnoverbis.org
- Federal Reserve H.10 foreign exchange ratesfederalreserve.gov
- ECB euro reference ratesecb.europa.eu
- US Bureau of Labor Statistics — Employment Situationbls.gov
เขียนโดย Elena Marsh
หัวหน้าผู้สอนเราเขียนบทเรียน forex ที่มีโครงสร้างและเข้าใจง่ายสำหรับผู้เริ่มต้น เน้นความเข้าใจเป็นอันดับแรกเสมอ — และไม่ใช่คำแนะนำทางการเงิน เนื้อหาหลักสูตรอยู่ใน หลักสูตร.
เรียนรู้ต่อไป
เส้นทางต่อไป
คู่มือที่เกี่ยวข้องกับหน้านี้มากที่สุด เรียงตามลำดับที่ต่อยอดจากหน้านี้ แต่ละคู่มือเป็นเนื้อหาที่สมบูรณ์ในตัวเอง และไม่มีคู่มือใดที่ถือว่าคุณอ่านหน้านี้จบแล้ว
- เวลาทำการของตลาด Forex: ทำไมถึงเปิด 24/5 และมีความหมายอย่างไรสำหรับคุณค้นพบแรงผลักดันระดับโลกเบื้องหลังการเคลื่อนไหวตลอดสัปดาห์ของตลาด Forex ทำความเข้าใจการหยุดพักในช่วงสุดสัปดาห์…
- การทดสอบไปข้างหน้าบนบัญชีทดลอง: กลยุทธ์อัจฉริยะเพื่อเร่งการเรียนรู้ของคุณอย่าปล่อยให้การเทรดในบัญชีทดลองยืดเยื้อ ค้นพบวิธีจำลองสภาวะตลาดจริงและรวบรวมการฝึกฝนหลายเดือนให้เป็นสัปดาห์…
- การติดแท็กการเทรดของคุณ: การค้นพบรูปแบบที่ซ่อนอยู่ในสมุดบันทึกการเทรดของคุณเรียนรู้วิธีจัดหมวดหมู่การเทรดของคุณอย่างเป็นระบบ เปลี่ยนข้อมูลดิบให้เป็นข้อมูลเชิงลึกที่นำไปใช้ได้จริง…
- เมื่อ Stop Loss ของคุณถูกแตะ: การที่ Spread ถ่างกว้างขึ้นกะทันหันอาจทำให้คุณไม่ทันตั้งตัวได้อย่างไรเทรดเดอร์หลายคนเข้าใจผิดคิดว่า Stop Loss ของตนจะปลอดภัยจนกว่าราคาที่แสดงจะไปถึง แต่การที่ bid-ask spread…
- คู่สกุลเงินหลัก, คู่สกุลเงินรอง และคู่สกุลเงินข้าม: ทำความเข้าใจประเภทของคู่สกุลเงินการทำความเข้าใจหมวดหมู่ต่างๆ ของคู่สกุลเงินเป็นสิ่งสำคัญสำหรับเทรดเดอร์ Forex ทุกคน ซึ่งส่งผลโดยตรงต่อความเสี่ยง สภาพคล่อง…