คู่มือ · 13 นาทีในการอ่าน · 2,661 words
การติดแท็กการเทรดของคุณ: ค้นพบรูปแบบที่ซ่อนอยู่ในบันทึกการเทรดของคุณ
เรียนรู้วิธีจัดหมวดหมู่การเทรดของคุณอย่างเป็นระบบ เปลี่ยนข้อมูลดิบให้เป็นข้อมูลเชิงลึกที่นำไปใช้ได้จริง ซึ่งจะเผยให้เห็นจุดแข็งและจุดอ่อนของคุณในฐานะเทรดเดอร์

ประเด็นสำคัญ
- การติดแท็กการเทรดจะช่วยจัดระบบบันทึกของคุณ เผยให้เห็นรูปแบบประสิทธิภาพที่คุณอาจไม่เคยสังเกตเห็น
- นอกเหนือจากรายละเอียดการเทรดพื้นฐาน ให้ติดแท็กกลยุทธ์เฉพาะของคุณ สภาวะตลาด และแม้แต่อารมณ์ของคุณ
- ค่า R-multiple ไม่ใช่แค่ P&L (กำไรขาดทุน) ในรูปตัวเงิน เป็นตัวชี้วัดคุณภาพของการเทรดและ 'edge' ของคุณที่แท้จริงที่สุด
- ไม่ว่าจะเป็นสเปรดชีตหรือซอฟต์แวร์เฉพาะ ความสม่ำเสมอในวิธีการติดแท็กของคุณสำคัญกว่าตัวเครื่องมือเอง
- กรองข้อมูลที่ติดแท็กของคุณเป็นประจำ เพื่อค้นพบข้อมูลเชิงลึกที่นำไปใช้ได้จริง เช่น กลยุทธ์ใดทำงานได้ดีที่สุดในสภาวะตลาดเฉพาะ หรือเมื่ออารมณ์บางอย่างนำไปสู่การขาดทุน
- ระบบการติดแท็กของคุณควรพัฒนาไปตามกาลเวลา ปรับเปลี่ยนเมื่อคุณมีความเข้าใจมากขึ้นเกี่ยวกับจุดแข็งและจุดอ่อนในการเทรดของคุณ
เรื่องราวที่มองไม่เห็นในข้อมูลการเทรดของคุณ
ลองจินตนาการถึงเทรดเดอร์สาวคนหนึ่งชื่อซาร่าห์ กำลังจ้องมองหน้าจอหลังจากสัปดาห์ที่ยากลำบาก ตัวเลขสีแดงเป็นส่วนใหญ่ เธอจำได้ว่ามีกำไรดีๆ บ้าง ขาดทุนเจ็บปวดบ้าง แต่ทุกอย่างดูเลือนลางไปหมด "เกิดอะไรขึ้นกันแน่?" เธอถามตัวเอง แต่คำตอบก็คือการยักไหล่แบบไม่แน่ใจ เธอรู้ว่าบางครั้งเธอก็เทรดได้ดี บางครั้งก็แย่ แต่ ทำไม ล่ะ? นี่ไม่ใช่แค่ปัญหาของซาร่าห์เท่านั้น เทรดเดอร์มือใหม่จำนวนมาก และแม้แต่ผู้มีประสบการณ์บางคน ก็ตกหลุมพรางของการมองงบกำไรขาดทุนเป็นเรื่องราวทั้งหมด มันไม่ใช่ มันเป็นเพียงบทสุดท้าย เรื่องราวที่แท้จริง ซึ่งเป็นเรื่องราวที่สอนคุณนั้น ซ่อนอยู่ในรายละเอียดของการเทรดแต่ละครั้ง
บันทึกการเทรดของคุณ หากคุณเก็บไว้ ก็คือสมุดบันทึกการตัดสินใจ รายการแต่ละรายการคือการตัดสินใจเดียวภายใต้เงื่อนไขเฉพาะ แต่การแค่จดว่า "ซื้อ EUR/USD แล้วขายทำกำไรในภายหลัง" ไม่ได้ให้ข้อมูลมากพอที่จะนำไปใช้ได้ มันเหมือนกับการมีห้องสมุดที่เต็มไปด้วยหนังสือที่ไม่มีชื่อเรื่อง ไม่มีผู้แต่ง ไม่มีประเภท คุณรู้ว่ามันอยู่ที่นั่น แต่การหาเล่มที่คุณต้องการ หรือการเห็นธีมที่เชื่อมโยงกันนั้นเป็นไปไม่ได้ นี่คือจุดที่การติดแท็กการเทรดเข้ามามีบทบาท มันคือบรรณารักษ์สำหรับบันทึกการเทรดของคุณ จัดระเบียบทุกการกระทำที่คุณทำ เพื่อให้เมื่อคุณย้อนกลับไปดู รูปแบบต่างๆ จะปรากฏให้เห็นอย่างชัดเจน คุณไม่จำเป็นต้องตามล่าหามัน
เป้าหมายไม่ใช่แค่การบันทึกสิ่งที่เกิดขึ้น เป้าหมายคือการทำความเข้าใจ ทำไม มันถึงเกิดขึ้น เพื่อแยกแยะตัวแปรที่นำไปสู่ความสำเร็จหรือความล้มเหลวของคุณ หากไม่มีวิธีจัดหมวดหมู่ตัวแปรเหล่านี้อย่างเป็นระบบ คุณจะพึ่งพาความทรงจำ ซึ่งขึ้นชื่อว่าไม่น่าเชื่อถือ โดยเฉพาะอย่างยิ่งเมื่อมีอารมณ์เข้ามาเกี่ยวข้อง เรากำลังสร้างระบบเพื่อเปลี่ยนข้อมูลดิบให้เป็นข้อมูลเชิงลึกที่นำไปใช้ได้จริง แสดงให้คุณเห็นว่าคุณเก่งตรงไหน คุณประสบปัญหาตรงไหน และที่สำคัญที่สุดคือ ทำไม
นอกเหนือจาก "ซื้อ" หรือ "ขาย": การติดแท็กการเทรดคืออะไร?
การติดแท็กการเทรดคือการกำหนดป้ายกำกับเชิงพรรณนาให้กับแต่ละองค์ประกอบของการเทรดของคุณ ลองนึกภาพว่ามันเหมือนกับการติดโพสต์อิทบนส่วนต่างๆ ของรายการเทรดของคุณ: อันหนึ่งสำหรับตลาดที่คุณอยู่ อีกอันสำหรับรูปแบบเฉพาะที่คุณเห็น และอันที่สามสำหรับความรู้สึกของคุณ แทนที่จะเป็นรายการบันทึกเดียวที่รวมทุกอย่าง คุณจะแยกย่อยออกเป็นองค์ประกอบที่สามารถค้นหาได้
สมมติว่าคุณเพิ่งเปิดสถานะ short ในดัชนี DAX ข้อมูลใดที่สำคัญอย่างแท้จริงเกี่ยวกับการเทรดเฉพาะนั้น? สินทรัพย์ ใช่ แต่ก็รวมถึงเหตุผลที่คุณเข้าเทรดด้วย มันเป็นการ breakout ของรูปแบบการรวมตัวหรือไม่? การ retest ของแนวต้านสำคัญหรือไม่? แนวโน้มโดยรวมเป็นขาขึ้นหรือขาลง? คุณรู้สึกมั่นใจ หรือกำลังไล่ตามการเคลื่อนไหว? ข้อมูลแต่ละส่วนเหล่านี้ เมื่อนำไปใช้กับการเทรดทุกครั้งอย่างสม่ำเสมอ จะกลายเป็นแท็ก
แนวทางที่มีโครงสร้างนี้ช่วยให้คุณสามารถกรองและจัดเรียงประวัติการเทรดทั้งหมดของคุณได้ ลองจินตนาการว่าสามารถถามบันทึกของคุณได้ว่า "แสดงการเทรด breakout ทั้งหมดของฉันในคู่ GBP/JPY ตอนที่ฉันรู้สึกมั่นใจมากเกินไป" หากไม่มีการติดแท็ก คำถามนั้นเป็นไปไม่ได้ที่จะตอบอย่างมีประสิทธิภาพ ด้วยการติดแท็ก คุณอาจพบรูปแบบที่ชัดเจน: การเทรดเหล่านั้น เช่น มักจะทำผลงานได้ไม่ดีอย่างสม่ำเสมอ นั่นคือข้อมูลเชิงลึกอันทรงพลังที่การดูงบ P&L เพียงอย่างเดียวไม่สามารถให้คุณได้ มันจะเปลี่ยนคุณจากการคาดเดาเกี่ยวกับประสิทธิภาพของคุณ ไปสู่การรู้กลไกของมัน
แท็กหลัก: สิ่งจำเป็นที่คุณไม่ควรมองข้าม
ทุกการเทรดต้องการข้อมูลพื้นฐานเป็นรากฐาน ข้อมูลนี้กำหนด "อะไร" และ "เมื่อไหร่" ของกิจกรรมของคุณ ซึ่งเป็นสิ่งที่ไม่สามารถต่อรองได้ คุณอาจติดตามรายละเอียดบางอย่างเหล่านี้อยู่แล้ว แต่การบันทึกอย่างสม่ำเสมอเป็นสิ่งสำคัญ
เริ่มต้นด้วยรายการพื้นฐานเหล่านี้:
- สินทรัพย์ (Instrument): คุณเทรดอะไร? (เช่น EUR/USD, ทองคำ, หุ้น Tesla)
- ทิศทาง (Direction): คุณเปิดสถานะ long (ซื้อ) หรือ short (ขาย)?
- วันและเวลาเข้า (Entry Date and Time): คุณเปิดการเทรดเมื่อไหร่? ระบุเขตเวลาด้วย
- ราคาเข้า (Entry Price): ราคาที่แน่นอนที่คุณเข้าเทรด
- วันและเวลาออก (Exit Date and Time): คุณปิดการเทรดเมื่อไหร่?
- ราคาออก (Exit Price): ราคาที่แน่นอนที่คุณออกจากเทรด
- ขนาดสถานะ (Position Size): คุณเทรดกี่หน่วย, กี่ lot หรือกี่หุ้น?
- Stop Loss (เริ่มต้น): คุณตั้ง Stop Loss เริ่มต้นไว้ที่ไหน?
- Take Profit (เริ่มต้น): คุณตั้งเป้าหมาย Take Profit เริ่มต้นไว้ที่ไหน?
- ผลลัพธ์ (P&L ในสกุลเงินและ R-multiple): ผลลัพธ์ทางการเงิน และที่สำคัญคือ R-multiple (กำไร/ขาดทุนของคุณหารด้วยความเสี่ยงเริ่มต้นของคุณ) คู่มือส่วนใหญ่ละเว้นส่วนนี้ การมุ่งเน้นเฉพาะ P&L ในรูปตัวเงินโดยไม่พิจารณาความเสี่ยงที่รับไปเป็นกับดักที่พบบ่อย ตัวอย่างเช่น กำไร €100 จากความเสี่ยง €50 คือการชนะ 2R; กำไร €100 จากความเสี่ยง €500 คือการชนะ 0.2R – ซึ่งเป็นผลงานที่แตกต่างกันมาก
แท็กหลักเหล่านี้เป็นแกนหลักของประวัติการเทรดของคุณ หากไม่มีสิ่งเหล่านี้ การวิเคราะห์เชิงลึกใดๆ ก็จะกลายเป็นการคาดเดา บันทึกประเด็นเหล่านี้อย่างแม่นยำสำหรับการเทรดทุกครั้ง ไม่ว่าจะมีขนาดหรือดูไม่สำคัญเพียงใด ความสม่ำเสมอในส่วนนี้เป็นสิ่งสำคัญอย่างยิ่ง
แท็กกลยุทธ์: การรู้ว่าคุณกำลังพยายามทำอะไร
เมื่อคุณเข้าใจพื้นฐานแล้ว การติดแท็กชั้นถัดไปจะเจาะลึกถึง เหตุผล นี่คือจุดที่คุณระบุกลยุทธ์การเทรดหรือรูปแบบเฉพาะที่คุณพยายามดำเนินการ นี่อาจเป็นหมวดหมู่ที่ทรงพลังที่สุดสำหรับการระบุว่าอะไรได้ผลและอะไรไม่ได้ผลในแผนการเทรดของคุณ
ตัวอย่างเช่น คุณกำลังเทรด "breakout ของแนวต้านรายวัน" หรือไม่? "pullback ไปยังค่าเฉลี่ยเคลื่อนที่ 50 คาบ" หรือไม่? "รูปแบบ double bottom" หรือไม่? ระบุให้เฉพาะเจาะจงที่สุดเท่าที่จะทำได้ หากคุณใช้หลายกลยุทธ์ ให้กำหนดแท็กที่ไม่ซ้ำกันสำหรับแต่ละกลยุทธ์ นี่ไม่ใช่แค่การระบุ ประเภท ของรูปแบบเท่านั้น แต่ยังรวมถึงพารามิเตอร์เฉพาะของมันด้วย คุณเทรด "inverted head and shoulders ที่มี 200-period MA confluence" หรือไม่? นั่นเป็นแท็กที่ดี
เทรดเดอร์จำนวนมากใช้แนวทางที่หลากหลาย ดังนั้นอย่ากลัวที่จะรวมแท็กหรือสร้างแท็กย่อย ตัวอย่างเช่น คุณอาจมีแท็กหลัก "Trend Following" และแท็กย่อยเช่น "Trend Following - Pullback Entry" หรือ "Trend Following - Momentum Break" สิ่งสำคัญคือต้องมีความสม่ำเสมอในการเลือกป้ายกำกับของคุณ หากคุณเรียกมันว่า "Breakout" ในวันนี้ อย่าเรียกมันว่า "Resistance Break" ในวันพรุ่งนี้ ความสม่ำเสมอนี้ช่วยให้แน่ใจว่าเมื่อคุณกรองข้อมูลของคุณ คุณกำลังเปรียบเทียบสิ่งเดียวกัน
รายละเอียดระดับนี้ก้าวข้ามการบันทึกการเทรดธรรมดาๆ ไปสู่การบันทึก เจตนา ของคุณ ในภายหลัง คุณจะเปรียบเทียบเจตนานั้นกับผลลัพธ์ที่แท้จริง ซึ่งเป็นจุดที่เกิดการเรียนรู้ที่แท้จริง
หมวดหมู่แท็กการเทรดทั่วไปและตัวอย่าง
| หมวดหมู่แท็ก | ตัวอย่างแท็ก | วัตถุประสงค์ |
|---|---|---|
| ประเภทสินทรัพย์ | คู่เงินหลัก (Forex Major), คู่เงินรอง (Forex Minor), ดัชนีหุ้น, สินค้าโภคภัณฑ์, หุ้นรายตัว | ช่วยวิเคราะห์ผลการดำเนินงานในสินทรัพย์ประเภทต่างๆ |
| ทิศทาง | Long, Short | การจำแนกประเภทพื้นฐานของสถานะการซื้อขายของคุณ |
| กลยุทธ์/รูปแบบการเข้าซื้อขาย | การทะลุกรอบ (Range Breakout), การตามแนวโน้ม (Trend Continuation), การดีดตัวจากแนวรับ (Support Bounce), การเทรดตามข่าว (News Play), Scalp | ระบุวิธีการเฉพาะที่ใช้ในการเข้าและจัดการการซื้อขาย |
| กรอบเวลา (Timeframe) | 5 นาที, 1 ชั่วโมง, 4 ชั่วโมง, รายวัน | เชื่อมโยงผลการดำเนินงานกับความละเอียดของกราฟที่คุณใช้ |
| สภาวะตลาด | ตลาดขาขึ้น (Trending Up), ตลาดขาลง (Trending Down), ตลาด Sideways, มีความผันผวนสูง, มีความผันผวนต่ำ | ให้บริบทเกี่ยวกับสภาวะตลาดในระหว่างการซื้อขาย |
| ผลลัพธ์การซื้อขาย | กำไร (Win), ขาดทุน (Loss), เท่าทุน (Breakeven) | การจำแนกประเภทผลการดำเนินงานอย่างง่าย |
| สภาพอารมณ์ | มั่นใจ, ใจร้อน, หงุดหงิด, มีวินัย | เชื่อมโยงสภาพอารมณ์กับผลลัพธ์การซื้อขาย |
| รูปแบบการจัดการ | ปิดทำกำไรตามเป้าหมาย (Full Target), ปิดทำกำไรบางส่วน (Partial Take), Trailed Stop, ตัดขาดทุนเร็ว (Cut Loss Early) | บันทึกวิธีการที่คุณจัดการการซื้อขายหลังจากเข้าสู่ตลาด |
| ช่วงเวลาซื้อขาย | ลอนดอน, นิวยอร์ก, เอเชีย | ช่วยให้ระบุได้ว่าช่วงเวลาซื้อขายใดมีประสิทธิภาพสูงสุดสำหรับคุณ |
แท็กสภาวะตลาด: บริบทคือหัวใจสำคัญ
การเทรดไม่ใช่เหตุการณ์ที่เกิดขึ้นโดดเดี่ยว แต่เกิดขึ้นภายใต้บริบทของตลาดที่กว้างขึ้นเสมอ การติดแท็กสภาวะเหล่านี้จะช่วยให้คุณเข้าใจว่ากลยุทธ์ของคุณทำงานได้ดีขึ้นในสภาพแวดล้อมแบบใด นี่เป็นจุดบอดที่พบบ่อยสำหรับเทรดเดอร์ที่มุ่งเน้นเพียงแค่สัญญาณเข้าเทรดของพวกเขา
ลองพิจารณาอารมณ์ของตลาด:
- แนวโน้ม: ตลาดมีแนวโน้มขึ้น ลง ชัดเจน หรือเป็นแบบผันผวนและไร้ทิศทาง (ranging)? คุณอาจติดแท็กว่า "แนวโน้มขาขึ้นที่แข็งแกร่ง" (Strong Uptrend), "แนวโน้มขาลงที่อ่อนแอ" (Weak Downtrend), หรือ "การเคลื่อนไหวออกข้าง" (Sideways Consolidation)
- ความผันผวน: ตลาดเคลื่อนไหวรวดเร็วและกว้าง หรือช้าและแคบ? แท็ก "ความผันผวนสูง" (High Volatility) หรือ "ความผันผวนต่ำ" (Low Volatility) อาจเป็นแท็กสำคัญ
- เหตุการณ์ข่าวสาร: มีรายงานเศรษฐกิจสำคัญที่กำลังจะประกาศหรือเพิ่งประกาศไปหรือไม่? "วัน NFP," "การประกาศ FOMC" หรือ "ช่วงเวลาก่อนข่าวเงียบ" (Pre-News Quiet) เป็นแท็กที่มีประโยชน์ บ่อยครั้งที่เหตุการณ์ข่าวสารเฉพาะเจาะจงสามารถส่งผลต่อการเคลื่อนไหวของราคาได้หลายวัน ตัวอย่างเช่น รายงาน Non-Farm Payrolls (NFP) จาก US Bureau of Labor Statistics สามารถสร้างความผันผวนอย่างมีนัยสำคัญในช่วงที่มีการประกาศ
- ช่วงเวลาของวัน/ช่วงเวลาซื้อขาย: คุณกำลังเทรดในช่วงตลาดลอนดอนเปิดที่คึกคัก ช่วงตลาดลอนดอน-นิวยอร์กที่ทับซ้อนกัน หรือช่วงตลาดเอเชียที่เงียบสงบกว่า? โบรกเกอร์หลายแห่ง เช่น Pepperstone ซึ่งมีสำนักงานใหญ่ในเมลเบิร์น ออสเตรเลีย ดำเนินงานครอบคลุมช่วงเวลาซื้อขายทั่วโลก แต่ประสิทธิภาพส่วนตัวของคุณอาจแตกต่างกันอย่างมาก ขึ้นอยู่กับช่วงเวลาที่คุณทำการเทรด
การทำความเข้าใจว่ากลยุทธ์ของคุณมีปฏิสัมพันธ์กับปัจจัยภายนอกเหล่านี้อย่างไรเป็นสิ่งสำคัญยิ่ง กลยุทธ์ที่โดดเด่นในตลาดที่มีแนวโน้มแข็งแกร่งอาจล้มเหลวในตลาดที่เคลื่อนไหวออกข้าง และในทางกลับกันก็เช่นกัน หากไม่มีแท็กบริบทเหล่านี้ คุณจะไม่สามารถแยกแยะระหว่างกลยุทธ์ที่ไม่ดีกับกลยุทธ์ที่ดีที่นำไปใช้ในสภาวะที่ไม่เหมาะสมได้ คุณจะเห็นเพียงแค่ผลกำไรและขาดทุน โดยไม่มี "เหตุผล" ที่สำคัญรองรับ
บันทึกการเทรดของคุณ หากได้รับการติดแท็กอย่างเหมาะสม จะกลายเป็นที่ปรึกษาส่วนตัว ที่แสดงให้คุณเห็นอย่างชัดเจนว่าอะไรได้ผลและอะไรไม่ได้ผลในสไตล์การเทรดที่เป็นเอกลักษณ์ของคุณ
แท็กอารมณ์และสภาวะจิตใจ: องค์ประกอบของมนุษย์
นี่คือจุดที่การพัฒนาตนเองจะเห็นผลเป็นรูปธรรม การเทรดไม่ใช่แค่เรื่องของกราฟและอินดิเคเตอร์เท่านั้น แต่เป็นเรื่องของจิตวิทยาอย่างลึกซึ้ง สภาวะจิตใจและอารมณ์ของคุณสามารถส่งผลกระทบอย่างมากต่อการตัดสินใจของคุณ การละเลยแง่มุมนี้หมายถึงการละเลยส่วนสำคัญอย่างยิ่งของปริศนาประสิทธิภาพของคุณ
ลองพิจารณาแท็กอารมณ์หรือสภาวะจิตใจเหล่านี้:
- วินัย: "ทำตามแผน" (Followed Plan), "เบี่ยงเบนจากแผน" (Deviation from Plan), "ไล่ตามราคา" (Chasing)
- ความมั่นใจ: "มั่นใจเกินไป" (Overconfident), "มั่นใจ (ตามแผน)" (Confident (planned)), "ขาดความมั่นใจ" (Lack of Confidence)
- ความอดทน: "เข้าเทรดอย่างอดทน" (Patient Entry), "เข้าเทรดอย่างใจร้อน" (Impatient Entry), "รอการยืนยัน" (Waiting for Confirmation)
- สมาธิ: "มีสมาธิสูง" (Highly Focused), "วอกแวก" (Distracted), "เหนื่อยล้า" (Fatigued)
- ความกลัว/ความโลภ: "กลัวตกรถ (FOMO)," "กลัวขาดทุน" (Fear of Losing), "โลภ (ขนาดตำแหน่งใหญ่เกินไป)" (Greedy (too large size))
ในตอนแรกสิ่งนี้อาจรู้สึกเป็นเรื่องส่วนตัวเล็กน้อย แต่เมื่อฝึกฝน คุณจะสามารถจดจำสภาวะของตนเองได้ดีขึ้น จงซื่อสัตย์กับตัวเองอย่างที่สุด หากคุณเข้าเทรดเพราะความเบื่อหน่าย ให้ติดแท็กว่า "เข้าเทรดเพราะเบื่อ" (Boredom Entry) หากคุณออกจากการเทรดเร็วเกินไปเพราะความกลัว ให้ติดแท็กว่า "ออกเพราะกลัว" (Fear Exit) แท็กเหล่านี้มักจะเผยให้เห็นมากที่สุด เนื่องจากมันชี้ให้เห็นถึงอคติทางความคิดและพฤติกรรมที่บ่อนทำลายความได้เปรียบของคุณ การมองตัวเองอย่างวิพากษ์วิจารณ์เป็นเรื่องยาก แต่เป็นสิ่งจำเป็นสำหรับการเติบโต
ตัวชี้วัดประสิทธิภาพ: การวัดผลความสำเร็จของคุณเชิงปริมาณ
ในขณะที่แท็กช่วยจัดหมวดหมู่ กระบวนการ ของการเทรดของคุณ คุณยังคงต้องการตัวชี้วัดที่เป็นรูปธรรมเพื่อวัด ผลลัพธ์ ของมัน ตัวชี้วัดเหล่านี้จะถูกคำนวณจากแท็กหลักของคุณ แต่ก็เป็นสิ่งที่ดีที่จะพิจารณาพวกมันเป็นองค์ประกอบที่แตกต่างกันสำหรับการวิเคราะห์
ตัวชี้วัดที่สำคัญที่สุดนอกเหนือจากกำไร/ขาดทุนแบบง่ายๆ คือ R-multiple สิ่งนี้ย่อมาจาก 'Risk Multiple' หรือ 'Reward to Risk Ratio' (อัตราส่วนผลตอบแทนต่อความเสี่ยง) หากจุดหยุดขาดทุนเริ่มต้นของคุณกำหนดหน่วยความเสี่ยง "1R" การเทรดที่ทำกำไรได้สองเท่าของจำนวนนั้นคือ "2R" win และการเทรดที่ขาดทุนครึ่งหนึ่งของจำนวนนั้นคือ "0.5R" loss ทำไมสิ่งนี้จึงสำคัญมาก? เพราะมันทำให้ผลลัพธ์ของคุณเป็นมาตรฐานเดียวกัน ไม่ว่าจะใช้ขนาดตำแหน่งที่แตกต่างกันและในสภาวะตลาดที่แตกต่างกัน กำไร €500 จากความเสี่ยง €50 (10R) เป็นการเทรดที่ดีกว่ามากในแง่ของกระบวนการและความได้เปรียบ กว่ากำไร €500 จากความเสี่ยง €1000 (0.5R) แม้ว่าผลตอบแทนทางการเงินสุทธิจะเท่ากันก็ตาม
ตัวชี้วัดประสิทธิภาพอื่นๆ ที่มีประโยชน์ซึ่งได้มาจากแท็กของคุณ ได้แก่:
- อัตราการชนะ: เปอร์เซ็นต์ของการเทรดของคุณที่ทำกำไรได้ (อ้างอิงจากแท็ก 'ผลลัพธ์' ของคุณ)
- R-win เฉลี่ย: ค่า R-multiple เฉลี่ยของการเทรดที่ชนะของคุณ
- R-loss เฉลี่ย: ค่า R-multiple เฉลี่ยของการเทรดที่ขาดทุนของคุณ
- ค่าคาดหวัง: การวัดว่าคุณสามารถคาดหวังผลกำไรเฉลี่ยต่อการเทรดได้เท่าไร โดยพิจารณาทั้งอัตราการชนะและ R-wins/losses เฉลี่ยของคุณ ตัวเลขนี้มักจะเป็นบวกสำหรับเทรดเดอร์ที่ทำกำไรได้อย่างสม่ำเสมอ
ด้วยการรวมแท็กโดยละเอียดของคุณเข้ากับตัวชี้วัดประสิทธิภาพเหล่านี้ คุณสามารถระบุได้อย่างรวดเร็วว่ากลยุทธ์ใดทำงานได้ดีที่สุด ในสภาวะตลาดแบบใด และแม้กระทั่งเมื่อคุณอยู่ในสภาวะจิตใจที่เหมาะสม สิ่งนี้เปลี่ยนการเทรดของคุณจากศิลปะไปสู่ศาสตร์ที่สามารถวัดผลได้มากขึ้น
การเลือกเครื่องมือของคุณ: บันทึกการเทรดดิจิทัล vs. สเปรดชีต
เมื่อคุณทราบแล้วว่าควรติดแท็ก อะไร คำถามในทางปฏิบัติคือ อย่างไร คุณมีตัวเลือกหลักๆ สองสามอย่าง ซึ่งแต่ละอย่างก็มีจุดแข็งและจุดอ่อนของตัวเอง
สเปรดชีต (Excel, Google Sheets): นี่เป็นตัวเลือกที่ยืดหยุ่นและคุ้มค่าที่สุด คุณสามารถสร้างระบบของคุณเองได้ตั้งแต่ต้น โดยสร้างคอลัมน์สำหรับแต่ละแท็ก ป้อนข้อมูล และใช้ฟังก์ชันในตัวสำหรับการกรอง การจัดเรียง และการคำนวณตัวชี้วัดประสิทธิภาพ ข้อได้เปรียบหลักคือการปรับแต่งได้อย่างสมบูรณ์ คุณเป็นผู้กำหนดแท็กและการคำนวณทุกอย่างด้วยตัวเอง ข้อเสียคือความพยายามในการตั้งค่าเริ่มต้นและความเป็นไปได้ที่จะเกิดข้อผิดพลาดจากการป้อนข้อมูลด้วยตนเอง ตัวอย่างเช่น หากคุณติดตามประสิทธิภาพในคู่สกุลเงินต่างๆ และป้อน "EUR/USD" ในบางครั้ง และ "EURUSD" ในครั้งอื่น ตัวกรองของคุณจะไม่ทำงานอย่างถูกต้อง ความสม่ำเสมอเป็นสิ่งสำคัญ โบรกเกอร์หลายแห่ง เช่น OANDA ซึ่งได้รับการโหวตให้เป็นโบรกเกอร์ Forex ที่ได้รับความนิยมสูงสุดและดีที่สุดโดย TradingView ในปี 2021 เสนอบันทึกประวัติการทำธุรกรรมโดยละเอียดที่คุณสามารถส่งออกได้ ทำให้การกรอกข้อมูลลงในสเปรดชีตง่ายขึ้น
ซอฟต์แวร์บันทึกการเทรดโดยเฉพาะ: มีแพลตฟอร์มมากมาย (เช่น TraderSync, Tradervue, Edgewonk) ซอฟต์แวร์เหล่านี้ได้รับการออกแบบมาโดยเฉพาะสำหรับเทรดเดอร์ มักจะนำเสนอการนำเข้าข้อมูลอัตโนมัติจากโบรกเกอร์ การวิเคราะห์ขั้นสูง และระบบการติดแท็กที่กำหนดไว้ล่วงหน้า พวกมันช่วยลดความยุ่งยากในการตั้งค่าไปได้มาก และมักจะให้การแสดงผลประสิทธิภาพด้วยภาพ ซึ่งจะซับซ้อนหากต้องสร้างในสเปรดชีต ข้อเสียหลักคือค่าใช้จ่าย ซึ่งโดยทั่วไปจะเป็นการสมัครสมาชิกรายเดือน และความยืดหยุ่นในการปรับแต่งที่น้อยกว่าเมื่อเทียบกับสเปรดชีตส่วนตัว
แอปจดบันทึก (Evernote, Notion): มีโครงสร้างน้อยกว่า แต่สามารถใช้ได้กับการติดแท็กที่เรียบง่ายมาก คุณอาจใช้แฮชแท็ก (#breakout, #long) ภายในข้อความที่ป้อนแบบอิสระ สิ่งนี้รวดเร็วและง่ายดาย แต่ขาดพลังการวิเคราะห์ของสเปรดชีตหรือซอฟต์แวร์เฉพาะทาง เหมาะที่สุดสำหรับผู้เริ่มต้นที่ต้องการสร้างนิสัยการบันทึกก่อนที่จะใช้ระบบที่ซับซ้อนมากขึ้น
เครื่องมือที่ดีที่สุดคือเครื่องมือที่คุณจะใช้จริงอย่างสม่ำเสมอ หากคุณมีความเชี่ยวชาญด้านเทคโนโลยีและสนุกกับการสร้างสิ่งต่างๆ สเปรดชีตเป็นตัวเลือกที่ยอดเยี่ยม หากคุณชอบโซลูชันสำเร็จรูปที่มีคุณสมบัติขั้นสูง แพลตฟอร์มเฉพาะทางจะดีกว่า
การเปรียบเทียบเครื่องมือบันทึกการเทรดที่ได้รับความนิยม
| คุณสมบัติ | สเปรดชีต (เช่น Excel/Google Sheets) | ซอฟต์แวร์บันทึกการเทรดโดยเฉพาะ (เช่น TraderSync) | แอปจดบันทึก (เช่น Notion) |
|---|---|---|---|
| ค่าใช้จ่าย | ฟรี (หากมีซอฟต์แวร์อยู่แล้ว) | แบบสมัครสมาชิก (โดยทั่วไป $29-$49 ต่อเดือน) | ฟรีถึงราคาไม่แพง |
| การปรับแต่ง | ยอดเยี่ยม (ควบคุมแท็ก การคำนวณ และเค้าโครงได้อย่างสมบูรณ์) | จำกัด (ช่องข้อมูลที่กำหนดไว้ล่วงหน้า, แท็กที่กำหนดเองบางส่วน) | ยอดเยี่ยม (การป้อนข้อความที่ยืดหยุ่น, แท็กที่เรียบง่าย) |
| ระบบอัตโนมัติ | การป้อนข้อมูลด้วยตนเอง, การนำเข้าข้อมูลพื้นฐานบางส่วน | มักจะมีการนำเข้าข้อมูลจากโบรกเกอร์แบบอัตโนมัติ, รายงานขั้นสูง | การป้อนข้อมูลด้วยตนเอง |
| การวิเคราะห์/การรายงาน | ต้องตั้งค่าสูตรและแผนภูมิด้วยตนเอง | การวิเคราะห์ขั้นสูงในตัว, แดชบอร์ดที่แสดงผลด้วยภาพ | มีข้อจำกัดมาก, ส่วนใหญ่เป็นการค้นหาข้อความ |
| เส้นทางการเรียนรู้ | ปานกลาง (ต้องมีทักษะการใช้สเปรดชีต) | ต่ำถึงปานกลาง (เฉพาะแพลตฟอร์ม) | ต่ำ (ทักษะการพิมพ์พื้นฐาน) |
| ความสามารถในการปรับขนาด | สูง (สามารถจัดการการเทรดนับพันรายการได้อย่างมีประสิทธิภาพ) | สูง (ออกแบบมาสำหรับชุดข้อมูลขนาดใหญ่) | ต่ำ (อาจจัดระเบียบได้ยากอย่างรวดเร็ว) |
ช่วงเวลาที่ "เข้าใจแจ่มแจ้ง": เมื่อรูปแบบต่างๆ ปรากฏขึ้น
นี่คือเหตุผลที่คุณทำสิ่งเหล่านี้ทั้งหมด เมื่อคุณมีข้อมูลที่ติดแท็กเพียงพอแล้ว—โดยอุดมคติคืออย่างน้อย 50-100 การเทรด แต่ยิ่งมากยิ่งดี—คุณก็สามารถเริ่มตั้งคำถามที่ทรงพลังกับบันทึกการเทรดของคุณได้ นี่คือจุดที่คุณจะเห็นรูปแบบต่างๆ ปรากฏขึ้นมาเองโดยที่คุณไม่ต้องค้นหา
- กรองตามกลยุทธ์: "แสดงการเทรดทั้งหมดที่ติดแท็ก 'Range Breakout'" ทีนี้ ลองดู R-multiples ของมัน ส่วนใหญ่เป็นบวกหรือไม่? ค่าเฉลี่ย R-win เทียบกับ R-loss เป็นเท่าไหร่? คุณอาจพบว่ากลยุทธ์ "Range Breakout" ของคุณที่คุณคิดว่าดีเยี่ยมนั้น แท้จริงแล้วมีค่าคาดหวัง (expectancy) เป็นลบ
- กรองตามสภาวะตลาด: "แสดงการเทรดทั้งหมดที่เกิดขึ้นในช่วงสภาวะ 'Low Volatility'" คุณทำผลงานได้ดีขึ้นหรือแย่ลง? บางทีกลยุทธ์โมเมนตัมของคุณอาจประสบปัญหาเมื่อตลาดเงียบ
- รวมตัวกรอง: "แสดงการเทรด 'Short' ทั้งหมดใน 'Forex Majors' ระหว่าง 'London Session' เมื่อฉันติดแท็ก 'Impatient Entry'" นี่คือจุดที่ความมหัศจรรย์เกิดขึ้น คุณอาจพบกลุ่มของการขาดทุนจำนวนมากที่นี่ ซึ่งบอกให้คุณหลีกเลี่ยงการ Short คู่สกุลเงินหลักอย่างใจร้อนในช่วงเวลา London Session
ข้อมูลเชิงลึกที่คุณได้รับนั้นสามารถเจาะจงได้อย่างไม่น่าเชื่อ คุณอาจพบว่าคุณทำกำไรได้อย่างสม่ำเสมอเมื่อเทรด EUR/USD แบบ Long ในกราฟ 4 ชั่วโมง โดยใช้การตั้งค่าตามแนวโน้มเฉพาะทาง แต่กลับขาดทุนทุกครั้งที่คุณพยายาม Short GBP/JPY ในกราฟ 15 นาทีด้วยกลยุทธ์ที่แตกต่างกัน สิ่งนี้จะเปลี่ยนคุณจากความเชื่อทั่วไปที่ว่า "ฉันเป็นเทรดเดอร์ที่ดี" หรือ "ฉันเป็นเทรดเดอร์ที่แย่" ไปสู่ความเข้าใจที่แม่นยำว่า: "ฉันมีประสิทธิภาพในสิ่งนี้ แต่ฉันต้องหยุดทำสิ่งนั้น" ข้อเสนอแนะที่เฉพาะเจาะจงและนำไปปฏิบัติได้จริงเช่นนี้คือวิธีที่เร็วที่สุดในการปรับปรุงประสิทธิภาพการเทรดของคุณ
ภาพรวมของข้อมูลจากโบรกเกอร์: สิ่งที่โบรกเกอร์ของคุณติดตามอยู่แล้ว (และสิ่งที่ไม่ติดตาม)
โบรกเกอร์ของคุณรวบรวมข้อมูลจำนวนมากเกี่ยวกับการเทรดของคุณอยู่แล้ว แพลตฟอร์มอย่าง MetaTrader 4 (MT4) หรือ MetaTrader 5 (MT5) ซึ่งโบรกเกอร์อย่าง Exness และ FxPro นำเสนออย่างแพร่หลายนั้น มีรายงานโดยละเอียดที่รวมถึงราคาเข้า/ออก, เวลา, ปริมาณ, และ P&L โบรกเกอร์หลายราย เช่น IC Markets ซึ่งก่อตั้งใน Sydney, Australia ยังนำเสนอเครื่องมือวิเคราะห์ที่ครอบคลุมภายในพอร์ทัลลูกค้าของพวกเขาอีกด้วย นี่เป็นจุดเริ่มต้นที่ดี แต่ก็ยังไม่เพียงพอ
รายงานของโบรกเกอร์มีความโดดเด่นในการให้ข้อมูลที่เป็นวัตถุประสงค์และข้อเท็จจริงของการเทรดของคุณ: ราคาที่แน่นอน, ค่าคอมมิชชั่นที่จ่ายไป, ค่า swap, และการเปลี่ยนแปลงของ equity ในบัญชีโดยรวม พวกเขาให้ข้อมูลดิบสำหรับ "อะไร" และ "เมื่อไหร่" อย่างไรก็ตาม โดยพื้นฐานแล้ว พวกเขาขาด บริบท และ เจตนา
โบรกเกอร์ของคุณไม่รู้ว่า ทำไม คุณถึงเข้าเทรด มันไม่รู้ว่าคุณทำตามแผนหรือไม่, เห็นรูปแบบกราฟเฉพาะหรือไม่, หรือรู้สึกเครียด มันจะไม่บอกคุณว่ากลยุทธ์ "trend following" ของคุณใช้ได้ผลดีกว่ากับทองคำหรือคู่สกุลเงิน นี่คือจุดที่ระบบการติดแท็กส่วนตัวของคุณกลายเป็นสิ่งจำเป็น มันช่วยเสริมข้อมูลที่เป็นข้อเท็จจริงจากโบรกเกอร์ของคุณด้วยข้อมูลเชิงลึกเชิงคุณภาพและเชิงกลยุทธ์ที่ไม่เหมือนใครในกระบวนการตัดสินใจของคุณ ลองคิดว่าข้อมูลของโบรกเกอร์คือสมุดบัญชีธุรกรรม และบันทึกการเทรดของคุณคือแผนที่กลยุทธ์ ทั้งสองอย่างจำเป็น แต่มีวัตถุประสงค์ที่แตกต่างกันและเสริมซึ่งกันและกัน
การปรับปรุงแท็กของคุณ: กระบวนการที่พัฒนาไปเรื่อยๆ
ระบบการติดแท็กการเทรดของคุณไม่ใช่สิ่งประดิษฐ์ที่หยุดนิ่ง; มันควรจะพัฒนาไปพร้อมกับคุณ เมื่อคุณได้รับข้อมูลเชิงลึก คุณจะต้องการเพิ่มแท็กใหม่หรือปรับปรุงแท็กที่มีอยู่ตามธรรมชาติ ตัวอย่างเช่น หลังจากวิเคราะห์ข้อมูลไม่กี่เดือน คุณอาจตระหนักว่าแท็ก "Trend" แบบง่ายๆ นั้นไม่ละเอียดพอ คุณอาจต้องการแบ่งย่อยออกเป็น "Strong Trend," "Weak Trend," หรือ "Early Trend Reversal."
กระบวนการทำซ้ำนี้มีความสำคัญอย่างยิ่ง ชุดแท็กเริ่มต้นของคุณคือสมมติฐานเกี่ยวกับปัจจัยที่ส่งผลต่อการเทรดของคุณ เมื่อคุณรวบรวมข้อมูล คุณก็จะทดสอบสมมติฐานนั้น หากแท็กใดไม่ให้ข้อมูลเชิงลึกที่เป็นประโยชน์ ให้พิจารณาเลิกใช้หรือรวมเข้ากับแท็กอื่น หากคุณพบตัวแปรใหม่ที่ดูเหมือนจะมีความสัมพันธ์กับผลงานของคุณ ให้สร้างแท็กใหม่สำหรับมัน การปรับปรุงอย่างต่อเนื่องนี้ช่วยให้บันทึกการเทรดของคุณยังคงเป็นเครื่องมือที่มีชีวิตชีวาที่ปรับเปลี่ยนไปตามการเติบโตของคุณในฐานะเทรดเดอร์ มันคล้ายกับการที่นักวิทยาศาสตร์ปรับปรุงการทดลองโดยอิงจากผลลัพธ์เบื้องต้น; คุณกำลังพัฒนาความเข้าใจในตลาดและตัวคุณเองอย่างต่อเนื่อง
สิ่งที่สำคัญที่สุดคือการทำอย่างต่อเนื่อง แม้การติดแท็กที่ไม่สมบูรณ์ก็ยังดีกว่าการไม่ติดแท็กเลย ความพยายามอย่างสม่ำเสมอเมื่อเวลาผ่านไปจะเปลี่ยนงานที่ดูน่ากลัวให้กลายเป็นแหล่งความรู้ด้วยตนเองและภูมิปัญญาในการเทรดอันล้ำค่า
อ่านแหล่งข้อมูลหลัก
ตรวจสอบได้ที่หน่วยงานกำกับดูแล ไม่ใช่ที่เรา
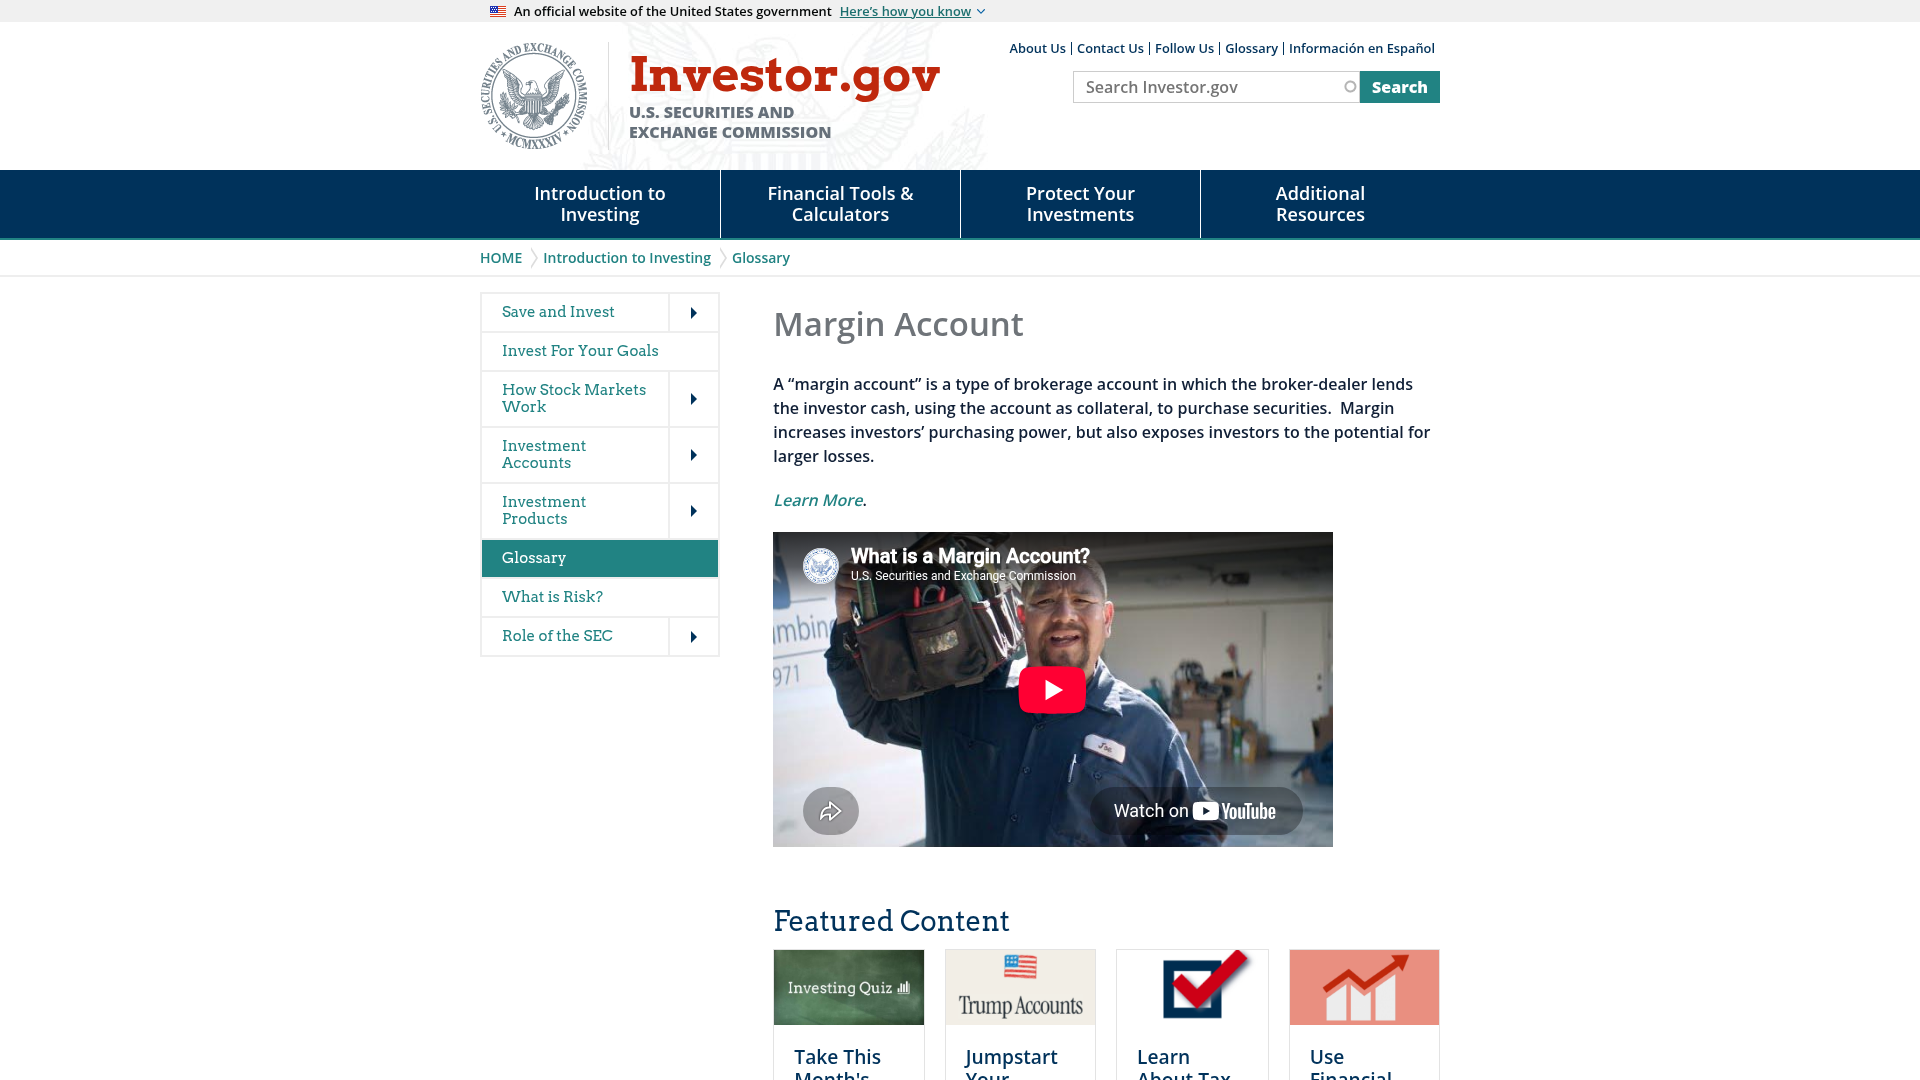
ภาพหน้าจอของหน้าเว็บทางการที่มาของกฎระเบียบในคู่มือนี้ เปิดดูด้วยตัวคุณเอง — คำพูดของหน่วยงานกำกับดูแลย่อมดีกว่าสรุปเสมอ
คำถามที่พบบ่อย
แหล่งที่มา
ที่มา
เขียนโดย Sofia Reyes
ผู้สอนด้านความเสี่ยงและจิตวิทยาเราเขียนบทเรียน forex ที่มีโครงสร้างและเข้าใจง่ายสำหรับผู้เริ่มต้น เน้นความเข้าใจเป็นอันดับแรกเสมอ — และไม่ใช่คำแนะนำทางการเงิน เนื้อหาหลักสูตรอยู่ใน หลักสูตร.
เรียนรู้ต่อไป
เส้นทางต่อไป
คู่มือที่เกี่ยวข้องกับหน้านี้มากที่สุด เรียงตามลำดับที่ต่อยอดจากหน้านี้ แต่ละคู่มือเป็นเนื้อหาที่สมบูรณ์ในตัวเอง และไม่มีคู่มือใดที่ถือว่าคุณอ่านหน้านี้จบแล้ว
- บันทึกการเทรด 2 นาที: เทมเพลตง่ายๆ ที่คุณจะใช้ได้จริงไปอีกหลายปีเรียนรู้วิธีที่บันทึกการเทรดรายวันแบบเรียบง่ายใช้เวลาเพียงสองนาที สามารถเปลี่ยนวินัยและกลยุทธ์การเทรดของคุณ…
- นิสัยหนึ่งเดียวที่แยกเทรดเดอร์ออกจากกัน: การจดบันทึกค้นพบว่าทำไมการจดบันทึกการเทรดอย่างละเอียดจึงเป็นนิสัยที่สำคัญที่สุด…
- Trading Setups: สร้างกฎที่ชัดเจนจนหุ่นยนต์ก็สามารถทำตามได้เรียนรู้วิธีเปลี่ยนแนวคิดการเทรดที่ไม่ชัดเจน ให้เป็นกลยุทธ์ที่แม่นยำและทดสอบได้…
- Trading Setup ของคุณโดดเด่นเฉพาะบางช่วงเวลาหรือไม่? นี่คือวิธีที่จะรู้เทรดเดอร์หลายคนพบว่ากลยุทธ์ของพวกเขาทำงานได้ดีเยี่ยมในบางครั้ง แต่กลับล้มเหลวในเวลาอื่น จังหวะของตลาด ไม่ใช่ทักษะของคุณ…
- นอกเหนือจากการคลิกเมาส์: การจับภาพหน้าจอการเทรดที่ช่วยเร่งการเรียนรู้ของคุณได้อย่างแท้จริงภาพหน้าจอการเทรดที่ดีเป็นมากกว่าแค่รูปภาพ เป็นเครื่องมือการเรียนรู้ที่สำคัญ เรียนรู้วิธีจับภาพและทบทวนอย่างมีประสิทธิภาพ…