Panduan · 25 menit baca · 2,217 words
Kebenaran Tentang Sumbu Panjang: Apa yang Mereka Sampaikan, dan Apa yang Tidak
Pelajari cara menafsirkan sumbu candlestick sebagai catatan visual penolakan harga dan sentimen pasar, namun pahami keterbatasan pentingnya sebelum membuat keputusan trading.

Poin-poin penting
- Sumbu panjang mewakili pertarungan sementara antara pembeli dan penjual, di mana satu pihak mendorong harga ke satu arah hanya untuk didorong kembali oleh pihak lain.
- Sumbu atas menunjukkan penolakan harga dari atas, menyiratkan penjual mendapatkan kembali kendali di level yang lebih tinggi, sementara sumbu bawah menandakan penolakan dari bawah, yang berarti pembeli masuk.
- Penafsiran sumbu sangat bergantung pada konteks, seperti level support/resistance di sekitarnya, tren keseluruhan, dan volume trading.
- Pola candlestick seperti Hammer, Shooting Star, dan Doji adalah formasi spesifik yang menggabungkan sumbu panjang, memberikan sinyal pembalikan yang lebih jelas ketika dikonfirmasi.
- Sumbu pada timeframe yang lebih tinggi (misalnya, harian atau mingguan) umumnya memiliki signifikansi lebih daripada yang ada di timeframe yang lebih rendah karena mewakili aksi harga yang lebih berkelanjutan.
- Sumbu bukanlah sinyal prediktif yang berdiri sendiri; mereka mencerminkan aksi harga masa lalu dan harus dikombinasikan dengan alat analisis teknikal lainnya dan manajemen risiko yang tepat.
Bisikan Pasar: Pandangan Pertama Anda pada Sumbu Candlestick
Bayangkan Anda melihat harga EUR/USD di layar Anda. Harga memulai hari di 1.0850. Untuk sementara, harga naik, mencapai 1.0920, terlihat kuat. Kemudian, sesuatu berubah. Pembeli kehilangan antusiasme mereka, dan penjual masuk. Pada saat periode trading berakhir, harga telah turun kembali ke 1.0870. Yang tersisa di grafik Anda adalah body kecil, menunjukkan harga pembukaan dan penutupan, tetapi ada garis panjang yang membentang hingga 1.0920. Garis itu? Itu adalah wick (sumbu), terkadang disebut shadow (bayangan).\n\nCandlestick menceritakan kisah yang kuat tentang aksi harga. Setiap candle mewakili satu periode, baik itu satu menit, satu jam, atau satu hari. Body candle menunjukkan di mana harga dibuka dan di mana harga ditutup selama periode tersebut. Wick atau shadow adalah garis tipis yang memanjang di atas dan di bawah body. Garis-garis ini menunjukkan harga tertinggi dan terendah yang dicapai selama periode yang sama. Ini adalah catatan visual tentang ke mana pasar mencoba bergerak, tetapi tidak dapat bertahan.\n\nSumbu panjang ibarat jejak kaki di pasir. Ini memberi tahu Anda bahwa harga mengunjungi level tertentu, tetapi kemudian sesuatu mendorongnya menjauh. Ini adalah sinyal cepat dan jelas bahwa pertarungan signifikan terjadi, dan satu pihak akhirnya menang, setidaknya untuk waktu tertentu itu. Memahami pertarungan ini adalah langkah kunci dalam belajar membaca niat pasar.
Kisah Bayangan Atas: Penolakan dari Atas
Sumbu atas yang panjang pada candlestick menceritakan kisah spesifik: pasar mencoba naik tetapi menghadapi resistensi kuat. Pertimbangkan skenario ini: pembeli awalnya mengendalikan pasar, mendorong harga naik. Mereka mencapai titik, misalnya, 1.1000 pada GBP/USD. Namun, pada atau tepat di atas level tersebut, gelombang penjual masuk. Penjual ini mengalahkan pembeli, memaksa harga turun kembali sebelum candle ditutup.\n\nUmumnya, sumbu atas yang lebih panjang menunjukkan penolakan yang lebih kuat. Ini berarti harga yang lebih tinggi tidak berkelanjutan; pasar tidak siap menerimanya. Ini sering menunjukkan bahwa pasokan melebihi permintaan pada titik harga tersebut. Ini menandakan potensi kelemahan, terutama jika muncul setelah uptrend signifikan atau pada level resistensi yang dikenal. Meskipun bukan jaminan pembalikan, ini sangat mengisyaratkan bahwa momentum kenaikan melemah, dan bear mungkin mendapatkan keuntungan.
Pola Candlestick Umum yang Menampilkan Sumbu Atas Panjang
| Nama Pola | Deskripsi Sumbu | Deskripsi Body | Implikasi Umum |
|---|---|---|---|
| Shooting Star | Sumbu atas panjang (setidaknya dua kali panjang body) | Batang kecil dekat level terendah dari rentang harga | Pembalikan bearish, penolakan harga yang lebih tinggi |
| Inverted Hammer | Sumbu atas panjang (setidaknya dua kali ukuran batang) | Batang kecil dekat level terendah dari rentang harga | Pembalikan bullish (jika ditemukan setelah tren turun) |
| Bearish Pin Bar | Sumbu atas sangat panjang, sumbu bawah sedikit atau tidak ada sama sekali | Batang kecil, seringkali berwarna merah | Penolakan kuat terhadap harga tertinggi, potensi kelanjutan tren turun atau pembalikan |
| Gravestone Doji | Sumbu atas panjang, tidak ada batang asli, tidak ada sumbu bawah | Harga pembukaan, tertinggi, terendah, penutupan sama atau sangat dekat | Pembalikan bearish, penolakan total terhadap tekanan beli |
Deklarasi Sumbu Bawah: Dukungan dari Bawah
Sebaliknya, sumbu bawah yang panjang menunjukkan ketahanan dan kekuatan beli. Awalnya, penjual mendominasi, mendorong harga turun. Pasar mungkin dibuka pada 0.9500 pada USD/CHF, dengan penjual mendorongnya ke 0.9420. Namun, pada level yang lebih rendah itu, gelombang pembeli baru masuk dengan tegas. Mereka menyerap semua tekanan jual dan mulai mendorong harga kembali naik, menutup candlestick secara signifikan lebih tinggi dari level terendahnya, bahkan mungkin lebih tinggi dari harga pembukaannya, pada 0.9480.
Sumbu ini mengindikasikan penolakan terhadap harga yang lebih rendah. Permintaan yang kuat ada pada level-level tersebut, dan pasar tidak bersedia untuk tetap berada di sana. Ini menunjukkan pembeli mulai masuk, mengenali nilai, dan siap mempertahankan titik-titik harga tersebut. Sumbu bawah yang panjang sering muncul setelah tren turun atau pada level support yang signifikan, menandakan potensi kelelahan tekanan jual dan pembalikan bullish yang sedang berkembang. Seperti sumbu atas, sumbu bawah yang lebih panjang menandakan penolakan yang lebih substansial terhadap harga yang lebih rendah.
Mengapa Satu Sumbu Saja Tidak Cukup: Pentingnya Konteks
Inilah bagian yang sering dilewati oleh sebagian besar panduan: satu sumbu panjang, secara terpisah, tidak berarti banyak. Ini seperti menemukan satu kepingan puzzle dan mencoba menebak seluruh gambaran. Untuk benar-benar memahami apa yang disampaikan oleh sebuah sumbu, Anda membutuhkan konteks. Di mana ia terbentuk? Apa yang dilakukan harga sebelumnya? Bagaimana tren pasar secara keseluruhan?
Pertimbangkan sumbu atas yang panjang. Jika ia terbentuk setelah rally besar yang berkelanjutan, itu adalah sinyal kelelahan yang jauh lebih kuat dibandingkan jika ia terbentuk di tengah konsolidasi sideways. Demikian pula, sumbu bawah yang panjang pada level support yang sudah mapan, di mana harga telah memantul berkali-kali sebelumnya, memiliki bobot yang jauh lebih besar daripada yang muncul secara acak di udara. Selalu zoom out pada chart Anda untuk melihat gambaran yang lebih besar. Cari zona supply and demand terdekat, trendline, atau moving average yang mungkin bertindak sebagai magnet atau penghalang harga. Elemen-elemen di sekitarnya inilah yang memberikan makna sebenarnya pada sumbu tersebut.
Tanpa perspektif yang lebih luas ini, Anda hanya melihat noise. Sumbu adalah tanda pertempuran, ya, tetapi signifikansinya berlipat ganda ketika pertempuran itu terjadi di lokasi yang strategis penting pada chart. Selalu tanyakan: 'Di mana posisi sumbu ini dalam skema besar?'
Menguraikan Pola Sumbu Klasik: Hammer, Star, dan Doji
Meskipun setiap candlestick dapat memiliki sumbu, pola candlestick tertentu didefinisikan oleh sumbu tersebut, menawarkan interpretasi yang lebih terstruktur. Pola-pola ini menggabungkan panjang sumbu dengan ukuran dan posisi batang untuk menandakan potensi pembalikan atau kelanjutan. Ambil contoh 'Hammer' dan 'Shooting Star'. Sebuah Hammer memiliki batang kecil (baik bullish maupun bearish) dan sumbu bawah yang panjang, muncul setelah tren turun. Ini menyiratkan bahwa penjual mencoba mendorong harga lebih rendah, tetapi pembeli menolaknya dengan kuat, mendorong harga kembali naik. Ini adalah sinyal pembalikan bullish.
'Shooting Star' adalah kebalikannya yang bearish, dengan batang kecil dan sumbu atas yang panjang, muncul setelah tren naik. Di sini, pembeli mendorong harga lebih tinggi, tetapi penjual menolak harga tertinggi tersebut, mendorong harga kembali turun. Ini menunjukkan potensi pembalikan bearish. Kemudian ada 'Dojis,' yang praktis tidak memiliki batang karena harga pembukaan dan penutupan hampir identik. Sumbu-sumbu mereka menunjukkan sejauh mana pergerakan harga selama periode tersebut. Sebuah 'Gravestone Doji' memiliki sumbu atas yang panjang dan tidak ada sumbu bawah, menandakan penolakan kuat terhadap harga tertinggi, sedangkan 'Dragonfly Doji' memiliki sumbu bawah yang panjang dan tidak ada sumbu atas, menunjukkan penolakan kuat terhadap harga terendah.
Pola-pola ini menyediakan cara singkat untuk memahami price action yang kompleks. Mereka dikenal luas dan sering digunakan sebagai sinyal masuk atau keluar oleh trader, meskipun selalu bersamaan dengan analisis lainnya. Mengenali bentuk-bentuk spesifik ini dapat membantu Anda dengan cepat menilai sentimen pasar.
Pola Candlestick Utama yang Didefinisikan oleh Sumbu
| Jenis Lilin | Bentuk | Konteks | Implikasi Hasil |
|---|---|---|---|
| Hammer | Badan kecil di bagian atas, sumbu bawah panjang | Setelah tren turun | Pembalikan bullish |
| Hanging Man | Badan kecil di bagian atas, sumbu bawah panjang | Setelah tren naik | Pembalikan bearish |
| Shooting Star | Badan kecil di bagian bawah, sumbu atas panjang | Setelah tren naik | Pembalikan bearish |
| Inverted Hammer | Badan kecil di bagian bawah, sumbu atas panjang | Setelah tren turun | Pembalikan bullish |
| Dragonfly Doji | Tanpa badan, sumbu bawah panjang | Setelah tren turun | Pembalikan bullish |
| Gravestone Doji | Tidak ada body (badan), sumbu atas panjang | Setelah uptrend | Pembalikan bearish |
Sumbu panjang adalah sinyal cepat dan jelas bahwa pertarungan signifikan terjadi antara pembeli dan penjual, dan satu pihak akhirnya menang, setidaknya untuk waktu tertentu itu.
Wick Lintas Waktu: Memahami Skala Grafik yang Berbeda
Sebuah wick pada grafik 5 menit tidak memiliki bobot yang sama dengan wick pada grafik harian atau mingguan. Ini adalah perbedaan krusial yang sering diabaikan banyak trader baru. Sebuah wick 5 menit merepresentasikan pergerakan harga dalam periode yang sangat singkat. Meskipun dapat menunjukkan penolakan, penolakan tersebut mungkin bersifat sementara dan mudah dikalahkan oleh pergerakan harga berikutnya. Ini seperti sebuah pertempuran kecil.
Namun, wick harian mencerminkan seluruh pertempuran antara pembeli dan penjual sepanjang hari. Jika harga ditolak pada level tertentu selama periode perdagangan 24 jam penuh, itu adalah peristiwa yang jauh lebih signifikan. Wick mingguan bahkan lebih kuat, merangkum sentimen pasar selama seminggu penuh. Wick pada timeframe yang lebih tinggi cenderung menjadi indikator yang lebih dapat diandalkan untuk sentimen pasar yang mendasari dan potensi perubahan tren.
Pikirkan seperti ini: apa yang tampak sebagai satu wick panjang pada grafik harian sebenarnya bisa menjadi serangkaian candle yang lebih kecil pada grafik 4 jam, bahkan berpotensi membentuk pola pembalikan mini di dalam wick yang lebih besar itu. Selalu pertimbangkan timeframe yang Anda analisis. Jika Anda mencari peluang perdagangan jangka panjang, fokuslah pada wick harian dan mingguan. Untuk scalping jangka pendek, bahkan wick 1 menit dapat memberikan sinyal cepat, tetapi disertai dengan peningkatan noise (gangguan) dan sinyal palsu.
Apa yang Sama Sekali *Tidak* Dijamin oleh Wick: Menghindari Keyakinan Palsu
Sangat penting untuk menjelaskan apa yang tidak dikatakan oleh wick panjang kepada Anda. Sebuah wick panjang bukanlah jaminan pembalikan (reversal). Ini tidak memprediksi masa depan. Ini adalah catatan historis dari pergerakan harga – momen di mana harga bergerak ke satu arah dan kemudian didorong kembali. Pasar bersifat dinamis, dan apa yang tampak seperti penolakan kuat dapat dengan cepat dinegasikan oleh informasi baru, rilis berita berdampak tinggi, atau sekadar lonjakan pesanan yang berlawanan.
Banyak trader pemula melihat wick panjang dan segera berasumsi bahwa pembalikan sudah dekat, lalu langsung masuk ke perdagangan tanpa konfirmasi lebih lanjut. Ini adalah jebakan umum. Sebuah upper wick panjang mungkin mengindikasikan pergerakan bearish, tetapi jika candle berikutnya melesat naik, sinyal tersebut secara efektif adalah palsu. Pasar tidak peduli dengan ekspektasi Anda. Pasar hanya bereaksi terhadap penawaran dan permintaan.
Jadi, meskipun wick berharga, jangan pernah menganggapnya sebagai sinyal yang tidak dapat salah atau sinyal tunggal. Mereka adalah potongan-potongan dari sebuah teka-teki, bukan gambaran keseluruhannya. Berdagang hanya berdasarkan satu wick, terutama tanpa memahami konteks atau tanpa menerapkan manajemen risiko, adalah resep untuk frustrasi. Selalu ingat bahwa harga dapat dan akan melakukan hal-hal yang tidak terduga.
Membangun Strategi: Menggabungkan Wick dengan Indikator Lain
Wick bukanlah sinyal tunggal, jadi bagaimana Anda menggunakannya secara efektif? Jawabannya adalah kombinasi. Anggap wick sebagai alat konfirmasi, menambahkan keyakinan pada analisis Anda yang sudah ada. Misalnya, jika Anda telah mengidentifikasi level resistance yang kuat pada grafik harian, dan harga mendekatinya, lalu membentuk upper wick panjang, wick tersebut menjadi sinyal yang kuat. Ini mengonfirmasi bahwa level resistance bertahan, dan penjual aktif di sana.
Wick juga bekerja dengan baik dengan moving average. Jika harga berada dalam downtrend dan kembali ke Exponential Moving Average (EMA) 20 periode yang menurun, lalu membentuk upper wick panjang di EMA tersebut, ini memperkuat gagasan bahwa EMA bertindak sebagai resistance dinamis, dan downtrend kemungkinan akan berlanjut. Anda juga dapat mencari divergence dengan oscillator seperti Relative Strength Index (RSI) atau Stochastic. Jika harga membuat high baru, tetapi RSI membuat lower high, dan kemudian upper wick panjang terbentuk, konfluensi sinyal tersebut jauh lebih meyakinkan daripada satu indikator saja.
Prinsip konfluensi ini—di mana beberapa indikator atau teknik analisis menunjuk pada kesimpulan yang sama—adalah landasan strategi perdagangan yang efektif. Semakin banyak bukti yang mendukung arah tertentu, semakin tinggi probabilitas keberhasilan perdagangan Anda. Wick sangat baik dalam memberikan bukti tambahan tersebut ketika dipasangkan dengan cermat.
Pengendalian Risiko: Menetapkan Stop di Sekitar Sinyal Wick
Salah satu aplikasi praktis wick adalah dalam risk management, khususnya untuk menetapkan order stop-loss. Ketika wick panjang memberi sinyal potensi pembalikan (reversal), titik ekstremnya seringkali menyediakan tempat yang alami dan logis untuk stop loss Anda. Jika masuk ke perdagangan short berdasarkan upper wick panjang yang mengindikasikan penolakan bearish, tempatkan stop loss Anda tepat di atas titik tertinggi wick tersebut.
Mengapa di sana? Karena jika harga bergerak melampaui high wick tersebut, itu menunjukkan bahwa sinyal penolakan kemungkinan tidak valid, dan penilaian awal Anda salah. Mempertahankan perdagangan yang merugi melewati titik tersebut akan bersifat spekulatif. Untuk perdagangan long berdasarkan lower wick panjang, stop loss Anda biasanya akan ditempatkan tepat di bawah titik terendahnya. Jika harga menembus di bawahnya, tekanan beli telah gagal.
Pendekatan sederhana ini dengan jelas mendefinisikan risiko maksimum Anda per perdagangan. Misalnya, jika lower wick panjang terbentuk pada EUR/USD di 1.0800, dengan wick menyentuh 1.0790, dan Anda masuk long di 1.0805, menempatkan stop Anda di 1.0789 (tepat di bawah low wick) berarti Anda berisiko 16 pips. Risiko konkret ini memungkinkan perhitungan position size yang tepat, memastikan Anda tidak mengambil risiko terlalu banyak modal pada satu perdagangan—prinsip dasar perdagangan. Inilah keindahan wick: mereka seringkali memberikan batasan yang jelas.
Aplikasi Praktis: Menggunakan Platform Perdagangan Anda untuk Analisis Wick
Platform perdagangan Anda adalah jendela Anda ke pasar, dan penting untuk mengetahui cara menggunakannya secara efektif untuk analisis wick. Baik Anda menggunakan MetaTrader 4, MetaTrader 5, atau TradingView, yang umum ditawarkan oleh broker seperti XM dan AvaTrade, fungsionalitas inti untuk analisis wick serupa. Pertama, biasakan diri Anda dengan mengubah timeframe. Berlatihlah beralih antara grafik 1 jam, 4 jam, dan harian untuk melihat bagaimana wick muncul pada skala yang berbeda. Perhatikan bagaimana wick besar pada timeframe yang lebih kecil mungkin hanya sebagian kecil dari body candle yang lebih besar pada timeframe yang lebih tinggi.
Selanjutnya, pelajari cara menggunakan alat gambar. Garis horizontal sangat cocok untuk menandai potensi level support dan resistance. Ketika wick panjang berinteraksi dengan salah satu garis ini, itu adalah observasi yang signifikan. Anda juga dapat menambahkan trendline untuk mengidentifikasi arah pasar secara keseluruhan. Jika wick panjang terbentuk yang menembus trendline dan kemudian kembali masuk, itu bisa menjadi false breakout, atau pengujian tren sebelumnya. Banyak platform juga memungkinkan Anda menambahkan indikator volume, yang, seperti yang telah kita bahas, sangat penting untuk mengonfirmasi kekuatan di balik penolakan wick.
Jangan lupakan akun praktik. Kebanyakan broker terkemuka menyediakan akun demo yang meniru kondisi pasar live. Ini adalah tempat yang tepat untuk berlatih mengidentifikasi wick, menggabungkannya dengan alat lain, dan bahkan menempatkan perdagangan hipotetis berdasarkan analisis Anda tanpa mempertaruhkan modal sungguhan. Platform seperti FxPro dan Exness membuat ini mudah.
Elemen Manusia: Bagaimana Wick Menunjukkan Psikologi Trader
Pada akhirnya, wick bukan hanya garis pada grafik; mereka adalah representasi langsung dari psikologi manusia di pasar. Setiap tick, setiap candle, setiap wick, adalah hasil dari jutaan keputusan yang dibuat oleh trader yang didorong oleh ketakutan, keserakahan, harapan, dan ketidakpastian. Sebuah upper wick panjang? Itu adalah keserakahan yang mendorong harga ke level yang tidak berkelanjutan, diikuti oleh ketakutan ketika penjual menyadari harga terlalu tinggi dan panik untuk mengambil keuntungan (profit taking) atau masuk short. Ini adalah pasar yang secara kolektif mengatakan, 'Tidak, belum.'
Sebuah lower wick panjang, di sisi lain, menunjukkan ketakutan awal atau panic selling, mendorong harga turun. Namun kemudian, harapan dan nilai yang dirasakan muncul. Pembeli, melihat penurunan sebagai peluang, masuk dengan keyakinan, mengalahkan penjual. Ini adalah pasar yang berteriak, 'Ya, ini harga yang bagus!' Pertempuran emosional ini konstan, terjadi di setiap timeframe, di setiap pasar.
Memahami psikologi yang mendasari ini membuat interpretasi wick menjadi lebih intuitif. Anda tidak hanya melihat pola; Anda melihat jejak emosi kolektif manusia. Perspektif ini membantu Anda mengantisipasi titik balik potensial, bukan sebagai kepastian, tetapi sebagai area dengan probabilitas tinggi di mana satu sisi pasar kemungkinan akan unggul. Teruslah berlatih membaca grafik Anda, dan kisah-kisah emosional ini akan menjadi semakin jelas.
Baca sumber utama
Periksa di regulator, bukan pada kami
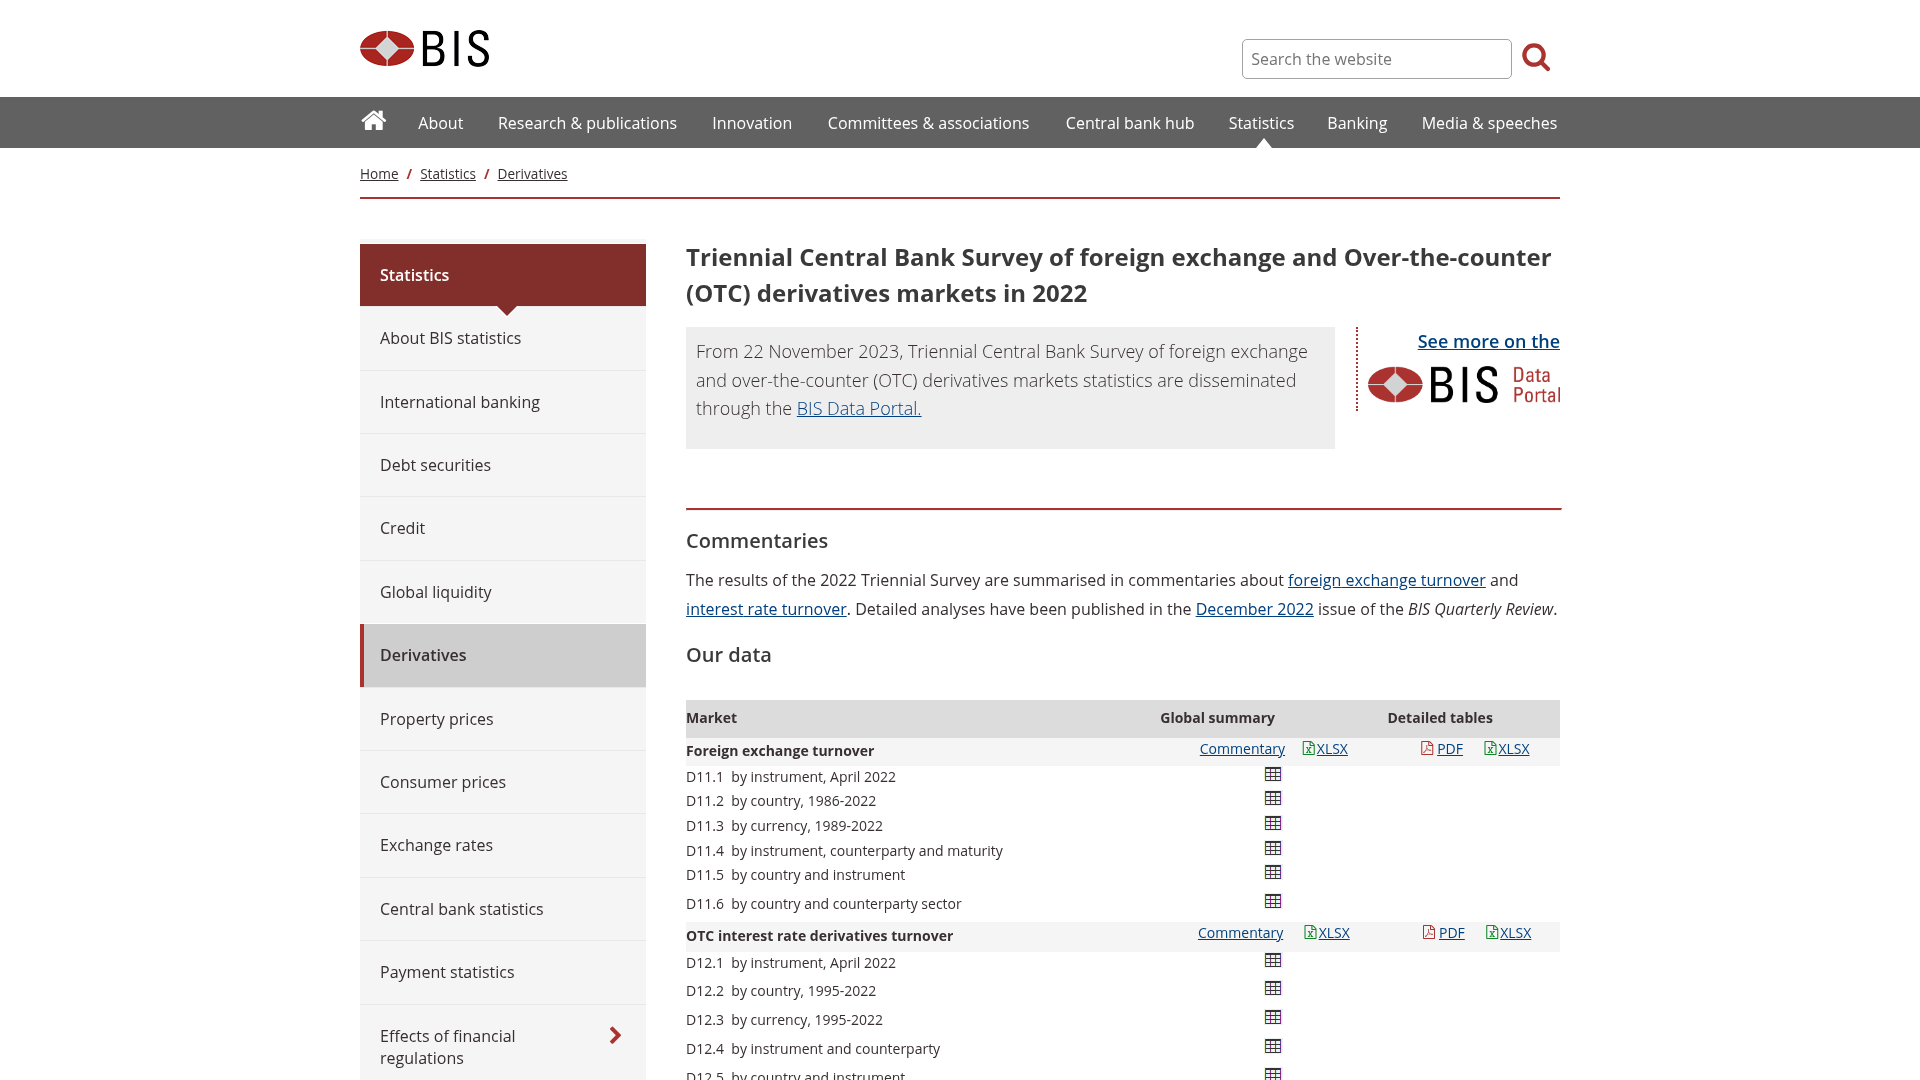
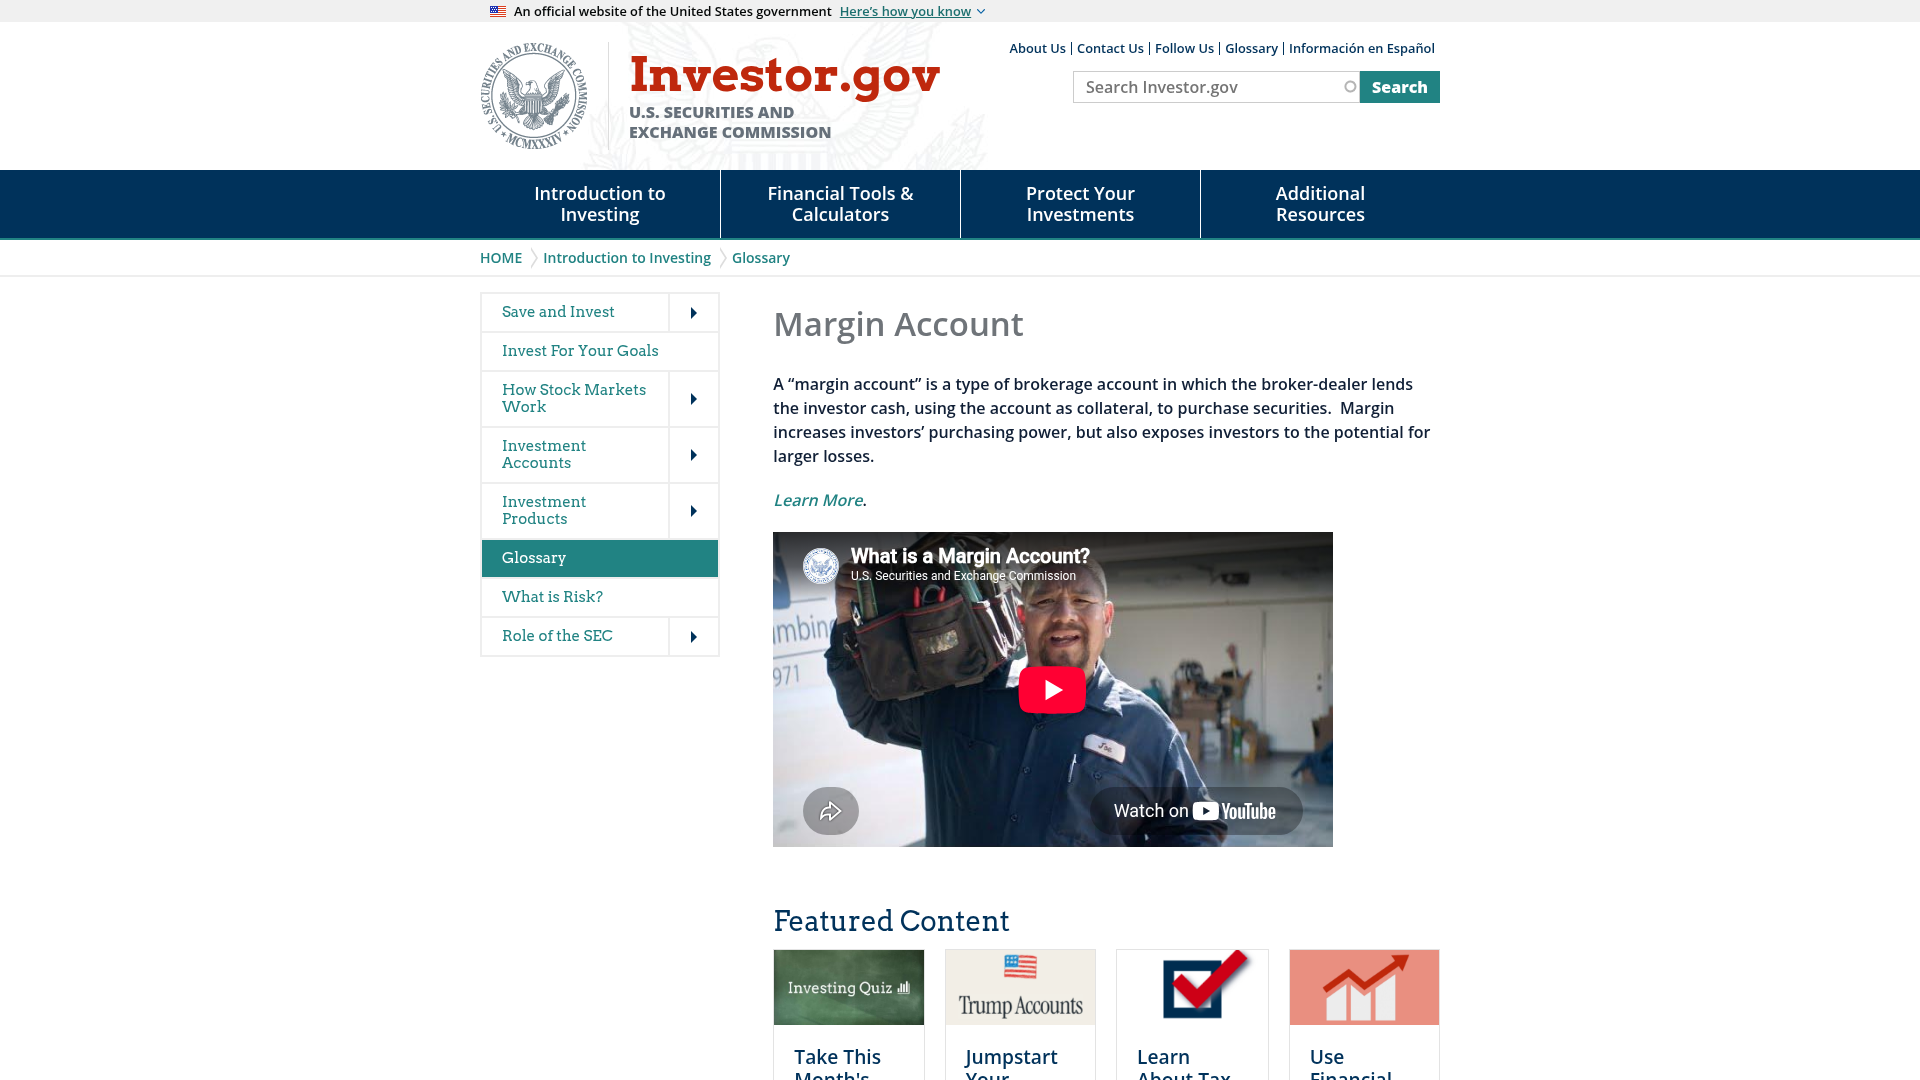
Tangkapan layar halaman resmi di balik aturan dalam panduan ini. Buka sendiri — kata-kata regulator sendiri selalu lebih baik daripada ringkasannya.
Sering ditanyakan
Sumber
Dari mana ini berasal
Ditulis oleh Sofia Reyes
Tutor Risiko & Psikologi. Kami menulis edukasi forex yang terstruktur, dalam bahasa Inggris sederhana untuk orang yang belajar dari awal. Pemahaman dulu, selalu — dan tidak pernah nasihat keuangan. Kursus itu sendiri ada di kurikulum.
Terus belajar
Ke mana panduan ini mengarah selanjutnya
Panduan yang paling dekat dengan ini, sesuai urutan pembangunannya. Masing-masing adalah bacaan lengkap tersendiri, dan tidak ada yang berasumsi Anda telah menyelesaikan halaman ini.
- Membaca Grafik Candlestick dari Nol MutlakPelajari cara menginterpretasikan grafik *candlestick*, bahasa visual harga pasar, dengan panduan ramah pemula ini untuk memahami…
- Candle Indecision: Membaca Pola Doji Tanpa Mengarang CeritaPelajari cara menginterpretasikan pola *doji candlestick* sebagai keraguan pasar yang asli, daripada langsung menyimpulkan tentang…
- Candle Engulfing: Mekanika Daripada SihirPelajari mekanika sederhana dari pola *candlestick engulfing bullish* dan *bearish* serta cara menggabungkannya ke dalam strategi…
- Grafik Garis, Batang, dan Candlestick: Memilih Jendela Anda ke PasarMemahami bagaimana harga divisualisasikan adalah fundamental; panduan ini menguraikan grafik garis, batang, dan *candlestick* untuk…
- Menggambar *Trendline* yang Dapat Ditindaklanjuti: Panduan Anda untuk Menentukan Titik Masuk *Trading*Pelajari metode yang tepat dan teknik validasi untuk menggambar garis tren (trendline) yang menyediakan level harga yang jelas dan…