دليل · 28 دقيقة قراءة · 2,619 words
رسم خطوط الاتجاه القابلة للتداول: دليلك لتحديد نقاط الدخول بدقة
تعلم الأساليب الدقيقة وتقنيات التحقق لرسم خطوط الاتجاه التي توفر مستويات سعرية واضحة وموثوقة لوضع أوامر التداول الخاصة بك.

أهم النقاط
- يتطلب خط الاتجاه الصالح حقًا ثلاث لمسات مؤكدة على الأقل، وليس اثنتين فقط، لتقديم إشارات تداول موثوقة وبناء الثقة.
- تكشف زاوية خط الاتجاه عن مدى استدامته؛ فالخطوط شديدة الانحدار أو المسطحة غالبًا ما تشير إلى ديناميكيات سعرية غير موثوقة.
- تكتسب خطوط الاتجاه قوة كبيرة عند التحقق منها بأدوات فنية أخرى مثل مناطق الدعم والمقاومة أو تحليل حجم السوق.
- انتظر دائمًا تأكيدًا صريحًا لسلوك السعر قبل التداول على ارتداد أو كسر خط الاتجاه؛ ولا تتوقع أبدًا قدرته على الصمود.
- يعدل المتداولون الجيدون خطوط الاتجاه مع تطور ظروف السوق، مدركين أنها أدلة ديناميكية وليست نبوءات ثابتة.
- تتطلب الأطر الزمنية المختلفة للتداول منظورات مختلفة لخطوط الاتجاه؛ فقد يكون الخط الصالح على الرسم البياني اليومي غير ذي صلة للمتداول السريع (scalper).
أكثر من مجرد ربط النقاط
يمسك العديد من المبتدئين بأداة الرسم البياني، ويربطون قمتين أو قاعين عشوائيين، ويطلقون عليه خط اتجاه. هذا أشبه برسم خط بين نجمتين عشوائيتين وتسميته كوكبة؛ قد يبدو جميلًا، لكنه لا يقدم أي توجيه حقيقي. خط الاتجاه المفيد حقًا في التداول ليس مجرد ملخص تاريخي لحركة السعر؛ بل هو أداة ديناميكية وتنبؤية مصممة لمساعدتك على توقع إلى أين قد يتجه السعر بعد ذلك، والأهم من ذلك، أين يمكنك فعليًا وضع أمر تداول.
التحدي الحقيقي ليس فقط رؤية الاتجاه، بل تحديده بدقة كافية ليقدم نقاط دخول وخروج ملموسة. يعمل خط الاتجاه الفعال كمستوى ديناميكي للدعم أو المقاومة، وهو حد يحترمه السعر. عندما يتفاعل السعر مع هذا الحد، فإنه يوفر حدثًا ذا احتمالية عالية لصفقة تداول. بدون هذه الدقة، فإن "خط الاتجاه" الخاص بك هو مجرد فن بياني، وليس إشارة تداول.
فكر في الأمر وكأنه نهر يتدفق. يمكنك رؤية النهر، لكن خط الاتجاه يساعدك على رسم خريطته. معرفة أين تكون هذه الضفاف قوية وأين قد تتآكل هو أمر أساسي. نبحث عن الأجزاء القوية من الضفة حيث قد يتغير التيار أو تتسارع سرعته، مما يمنحنا نقطة واضحة للدخول أو الخروج من الماء.
قاعدة اللمسات الثلاث ومنطقها
مبدأ أساسي غالبًا ما يغفله المبتدئون هو "قاعدة اللمسات الثلاث". بينما تحدد نقطتان أي خط مستقيم، إلا أنهما لا تؤكدان صلاحية خط الاتجاه لأغراض التداول. تخيل ملعب كرة سلة: لاعبان يقفان ساكنين لا يشكلان لعبة؛ بل هي التمريرة الثالثة، الارتداد الثالث، التي تبدأ في ترسيخ نمط اللعب. لكي يُعتبر خط الاتجاه ذا أهمية وموثوقية حقيقية، يجب أن يلامسه السعر ويتفاعل معه بشكل مقنع ثلاث مرات على الأقل.
تحدد اللمستان الأوليان الميل والمسار المحتمل للاتجاه. إنهما تقدمان فكرة أولية عن الاتجاه. ومع ذلك، فإن اللمسة الثالثة المؤكدة هي التي يعترف فيها المشاركون في السوق، بشكل جماعي، ويعززون هذا المستوى السعري المحدد كحد مهم. يوفر هذا التفاعل الثالث تحققًا حاسمًا. عندما يقترب السعر من الخط للمرة الثالثة ويرتد بعيدًا أو يخترقه بقوة، فإنه يشير إلى أن السوق الأوسع يولي اهتمامًا لهذا المستوى. يزيد هذا الاعتراف المشترك من احتمالية أن تكون التفاعلات المستقبلية مع الخط ذات مغزى أيضًا.
بدون تلك اللمسة الثالثة، فإنك في الأساس تتكهن بنمط لم يثبت نفسه. إنه مثل محاولة التنبؤ بمسار كرة القدم بعد نصف ركلة فقط. تمنحك اللمسة الثالثة الثقة بأن الخط ليس مجرد صدفة، بل هو مستوى يحظى باحترام واسع. هذه السيكولوجية الجماعية للسوق هي التي تجعل خط الاتجاه قابلاً للتداول، وتحوله من مجرد ملاحظة إلى إعداد محتمل لصفقة.
مقارنة موثوقية خطوط الاتجاه بناءً على عدد اللمسات المؤكدة.
| المعيار | Unreliable Trendline (2 Touches) | خط اتجاه موثوق (3 لمسات فأكثر) |
|---|---|---|
| مستوى التأكيد | إيحائي فقط، احتمالية فشل عالية | ثقة عالية، مستوى معترف به في السوق |
| حركة التداول | مخاطرة عالية، وغالباً ما تؤدي إلى إشارات خاطئة | مخاطرة أقل، وتوفر نقاط دخول/خروج أوضح |
| سيكولوجية السوق | اعتراف جماعي محدود | اعتراف جماعي قوي وتعزيز |
| القوة التنبؤية | ضعيفة، وعرضة للإبطال الفوري | أقوى، وتوفر تفاعلات مستقبلية أكثر موثوقية |
تحديد التأرجحات الصحيحة: القمم والقيعان
هذا هو الجزء الذي تتجاهله معظم الأدلة، بافتراض أنك 'تعرف' بالفعل كيف تبدو قمة أو قاع التأرجح المهم. ولكن ليست كل القمم والقيعان متساوية الأهمية. فعند رسم خط الاتجاه، أنت لا تربط أية قمة أو قاع؛ بل تربط نقاط التحول المهمة التي انعكس فيها السعر بحركة واضحة وملحوظة. هذه هي النقاط التي تمثل تحولات حقيقية في معنويات السوق أو استنفاد ضغط الشراء/البيع.nnعادةً ما تكون قمة التأرجح المهمة شمعة بها شمعتان على الأقل من القمم الأدنى على جانبيها، ثم يتبعها حركة هبوط مستمرة. وعلى النقيض، يكون قاع التأرجح المهم شمعة بها شمعتان على الأقل من القيعان الأعلى على جانبيها، ثم يتبعها حركة صعود مستمرة. الحركة 'المستمرة' هي المفتاح. إذا تحرك السعر بضعة pips فقط ثم انعكس، فهذه ليست نقطة تأرجح قوية بما يكفي لتثبيت خط اتجاه. نحن نبحث عن نقاط تحدد بداية أو نهاية حركة سعرية واضحة، وليس مجرد ضوضاء داخلية في السوق.nnتدرب على تصغير الرسم البياني الخاص بك. ابحث عن 'قمم الجبال' و 'الوديان' التي تبرز بوضوح، بدلاً من التلال والمنخفضات الأصغر. هذه التأرجحات البارزة هي مراسٍ لخطوط الاتجاه الخاصة بك. يضمن الرسم من هذه النقاط أن يلتقط خط الاتجاه الزخم الحقيقي الكامن، بدلاً من أن يتشوه بسبب التقلبات السعرية الطفيفة التي لا تعكس تغيراً في اتجاه الاتجاه الأوسع.
فن الزاوية: الانحدار والاستدامة
تعد زاوية خط الاتجاه الخاص بك مؤشراً صامتاً على صحة الاتجاه واستدامته. فخط الاتجاه المرسوم بانحدار شديد، يكاد يكون عمودياً، يشير إلى اندفاع غير مستدام لضغط الشراء أو البيع. وبينما يمكن أن تكون هذه التحركات مثيرة، إلا أنها غالباً ما تكون قصيرة الأجل وعرضة لانعكاسات حادة ومفاجئة أو تصحيحات عميقة. تخيل أنك تركض صعوداً بأقصى سرعة؛ لا يمكنك الحفاظ على هذا الإيقاع لفترة طويلة جداً قبل أن تحتاج إلى الإبطاء أو حتى التوقف. وبالمثل، يحذر خط الاتجاه شديد الانحدار من أن السوق من المرجح أن 'يلتقط أنفاسه' قريباً، مما يعني أن كسراً أو تراجعاً كبيراً وشيك.nnمن ناحية أخرى، يشير خط الاتجاه المسطح جداً إلى سوق ضعيف، وغالباً ما يكون جانبي الاتجاه. تفتقر هذه الاتجاهات المسطحة إلى الاقتناع، مما يجعل الارتدادات والاختراقات أقل موثوقية. يميل السعر إلى التذبذب حول هذه الخطوط، مما يخلق إشارات متقطعة ويزيد من عدم اليقين. إنه يشبه تيار نهر لطيف؛ يتحرك، ولكن ليس بقوة كافية للتنقل بثقة. للحصول على خطوط اتجاه قابلة للتداول، نبحث عن زاوية معتدلة – ليست شديدة الانحدار ولا مسطحة جداً – تمثل زخماً صحياً ومستداماً. تتيح زاوية 'النقطة المثلى' هذه تقدماً ثابتاً دون أن يكون مرهقاً بشكل مفرط.nnبينما لا يوجد قياس دقيق للدرجة يناسب جميع الأسواق والأطر الزمنية، فإن القاعدة العامة الجيدة هي البحث عن زوايا تبدو مستدامة على مدى فترة، مما يسمح بتراجعات أو ارتفاعات طبيعية ضمن الاتجاه. إذا كان خط الاتجاه الخاص بك يبدو وكأنه سلم مستقيم إلى السماء أو منحدر بالكاد ملحوظ، فأعد النظر في صلاحيته طويلة الأجل كأداة تداول. يوفر خط الاتجاه ذو الزاوية الجيدة تفاعلات إيقاعية يمكن التنبؤ بها وأسهل في التداول.
ما وراء السعر: دمج الحجم والوقت
لا توجد خطوط الاتجاه في فراغ؛ فغالباً ما يتم تأكيد قوتها وموثوقيتها من خلال ديناميكيات السوق الأخرى، خاصة حجم التداول والمدة التي كانت فيها نشطة. عندما يقترب السعر من خط اتجاه، راقب حجم التداول. فالارتداد القوي عن خط اتجاه دعم، خاصة إذا كان مصحوباً بزيادة في حجم الشراء، يضيف مصداقية كبيرة لهذا الخط. وبالمثل، يشير كسر خط اتجاه مقاومة بحجم تداول مرتفع إلى اقتناع حقيقي وراء الحركة، مما يزيد من احتمالية استمرار الكسر. ومع ذلك، يمكن أن يكون حجم التداول المنخفض عند الكسر أو الارتداد علامة تحذير، مما يشير إلى نقص المشاركة الحقيقية في السوق وإشارة خاطئة محتملة.nnعنصر الوقت حاسم أيضاً. فخط الاتجاه الذي صمد لأسابيع أو أشهر، وتم اختباره عدة مرات عبر جلسات مختلفة، يحمل وزناً أكبر بكثير من خط مرسوم على رسم بياني لمدة 15 دقيقة وكان صالحاً لبضع ساعات فقط. خطوط الاتجاه الأقدم والأكثر اختباراً، خاصة على الأطر الزمنية الأعلى، تصبح متأصلة بعمق في الوعي الجماعي للسوق. إنها تمثل حدوداً فنية مهمة يراقبها العديد من المتداولين والخوارزميات، مما يجعل تفاعلاتها أكثر قابلية للتنبؤ والتداول. على سبيل المثال، يشهد سوق الصرف الأجنبي تداول تريليونات الدولارات يومياً، كما أبرز مسح BIS Triennial Central Bank Survey of FX turnover، وتعكس خطوط الاتجاه الرئيسية على الرسوم البيانية اليومية أو الأسبوعية هذه التدفقات الهائلة.nnعندما تجمع بين خط اتجاه مرسوم جيداً وحجم تداول مؤكد وسجل حافل بالاستمرارية، فإنك تبني حجة أقوى بكثير لفكرة تداولك. يشبه الأمر رؤية لافتة طريق، ثم التحقق من خريطتك، وأخيراً رؤية سيارات أخرى تتبع نفس المسار. كل معلومة تعزز موثوقية الاتجاه العام. لا تتجاهل أبداً هذه الطبقات الإضافية من التأكيد؛ فهي يمكن أن تحدث فرقاً بين إعداد ذي احتمالية عالية ورمي عملة.
خط الاتجاه الذي لم يؤكده سلوك السعر عبر لمسات متعددة هو مجرد خط على شاشتك، وليس خطة تداول.
تحسين خطوطك: الفتيل أم الجسم؟
نقطة خلاف شائعة بين المتداولين هي ما إذا كان يجب رسم خطوط الاتجاه باستخدام فتائل الشموع (الظلال) أو أجسام الشموع (الجسم الحقيقي). لكلا النهجين مؤيدوهما، ولكن بعد سنوات من مراقبة سلوك السوق، أتخذ موقفاً حازماً: الرسم عبر الفتائل يوفر عموماً حداً أكثر دقة وقابلية للتداول. يمثل الفتيل أقصى سعر مطلق تم الوصول إليه خلال فترة، مما يدل على أقصى نقطة رفض من قبل المشاركين في السوق. عندما ينعكس السعر باستمرار عند هذه المستويات القصوى، فإنه يرسم صورة أوضح لمكان رسم خطوط معركة العرض والطلب الفعلية.nnالرسم عبر الأجسام يربط أسعار الافتتاح والإغلاق، والتي تمثل سعر الإجماع لتلك الفترة. وبينما يمكن أن يكون هذا مفيداً لفهم المعنويات العامة، إلا أنه غالباً ما يتجاهل الاختراقات القصيرة، لكنها مهمة، من قبل السعر إلى المستويات القصوى التي تم رفضها في النهاية. هذه الرفضات، التي تظهرها الفتائل، حاسمة لتحديد نقاط التحول الدقيقة. فالأمر الموضوع بعد خط اتجاه مبني على الفتيل مباشرةً لديه وضع وقف خسارة أضيق، مما يوفر نسبة مخاطرة إلى مكافأة أفضل لأنه يأخذ في الاعتبار أعمق اختراقات السوق قبل الانعكاس.nnعملياً، عندما يقترب السعر من خط اتجاه مبني على الفتيل، فإن الارتداد المباشر من الفتيل أو الرفض الواضح بعد اختراق طفيف للفتيل ('كسر كاذب') غالباً ما يوفر أقوى الإشارات. إذا رسمت عبر الأجسام، فقد تجد السعر يخترق خطك باستمرار قبل الانعكاس، مما يؤدي إلى دخول مبكر أو إيقاف الخسارة. وبينما يجادل البعض بأن الرسم عبر الأجسام يخلق خطاً 'أكثر سلاسة'، فإن التداول ليس عن الجماليات؛ بل عن نقاط التفاعل الدقيقة. لذلك، لتحديد نقاط الدخول في الصفقات وإدارة المخاطر بفعالية، يميل ربط خطوط الاتجاه الخاصة بك بأقصى حدود الفتيل إلى تحقيق نتائج أكثر موثوقية. يضمن هذا النهج أنك تأخذ في الاعتبار المدى الكامل لوصول السعر.
مقارنة بين رسم خطوط الاتجاه باستخدام فتائل الشموع مقابل أجسام الشموع للتداول الفعال.
| طريقة الرسم | المزايا | العيوب | الاستخدام الموصى به |
|---|---|---|---|
| الذيول (الحدود القصوى) | إشارات دخول/خروج أكثر دقة، وضع أفضل لأمر وقف الخسارة (stop-loss)، والتقاط أقصى رفض للسعر. | قد تبدو 'أكثر تذبذبًا'، وقد تحتوي على عدد أقل من اللمسات المؤكدة إذا لم يتم رسمها بشكل صحيح. | التداول الدقيق، تحديد نقاط الانعكاس الدقيقة، إدارة المخاطر المحكمة. |
| الأجسام (الافتتاح/الإغلاق) | قد تبدو 'أكثر سلاسة'، وتمثل سعر الإجماع للفترة، ومفيدة لتحديد الاتجاه العام للسوق. | أقل دقة لوضع الأوامر، غالبًا ما يخترق السعر قبل الانعكاس، مما يؤدي إلى إشارات خاطئة. | قياس معنويات السوق العامة، تحديد الاتجاه طويل الأجل (أقل قابلية للتطبيق للدخول في الصفقات). |
الاختراق وإعادة الاختبار: إشارة دخولك
خط الاتجاه ليس من المفترض أن يصمد إلى الأبد. في نهاية المطاف، سيخترق السعر هذا الخط. لكن الاختراق البسيط ليس دائمًا إشارة تداول؛ غالبًا ما تأتي أفضل نقاط الدخول الموثوقة من 'إعادة اختبار' خط الاتجاه المخترق. فكر في الأمر كجدار تم اختراقه. قبل أن يلتزم المهاجمون بالتحرك بالكامل إلى ما وراءه، غالبًا ما يتوقفون لتعزيز موقفهم، وفي بعض الأحيان يتراجعون لفترة وجيزة إلى الجدار لاختبار استقراره أو لجمع المزيد من القوة. هذا ما يحدث مع إعادة الاختبار.
عندما يخترق السعر خط اتجاه المقاومة للأعلى، من الشائع أن يتراجع السعر إلى هذا الخط، الذي يعمل الآن كدعم جديد، قبل أن يواصل صعوده. إذا اخترق السعر خط اتجاه الدعم للأسفل، فغالبًا ما يرتفع مرة أخرى لإعادة اختبار هذا الخط، الذي أصبح الآن مقاومة جديدة، قبل أن يواصل انخفاضه. هذه الظاهرة، المعروفة باسم 'تحول الدعم القديم إلى مقاومة جديدة' والعكس صحيح، توفر نقطة دخول ذات احتمالية أعلى من مجرد مطاردة الاختراق الأولي.
أثناء إعادة الاختبار، ابحث عن أنماط شموع يابانية محددة تؤكد الدور الجديد لخط الاتجاه. يشير نمط الابتلاع الصاعد (bullish engulfing) أو شمعة الدبوس (pin bar) التي تتشكل عند خط الدعم الذي أعيد اختباره إلى عودة ضغط شراء قوي. وبالمثل، تشير شمعة الابتلاع الهابط (bearish engulfing) أو شمعة الدبوس (pin bar) عند خط مقاومة أعيد اختباره إلى دخول البائعين. الانتظار لهذا التأكيد يتجنب الوقوع في الاختراقات الكاذبة، حيث يخترق السعر الخط لفترة وجيزة فقط ليعود بسرعة إلى الاتجاه الأصلي. هذا الصبر يمكن أن ينقذك من العديد من الصفقات الخاسرة ويضمن أن تكون نقاط دخولك مبنية على تحولات مؤكدة في ديناميكيات السوق.
خطوط الاتجاه في الأسواق والأطر الزمنية المختلفة
يمكن أن تختلف فعالية خطوط الاتجاه وتفسيرها بشكل كبير اعتمادًا على السوق الذي تتداول فيه والإطار الزمني الذي تراقبه. في الأسواق ذات السيولة العالية مثل أزواج العملات الرئيسية في الفوركس، والتي يمكن أن تشهد متوسط حجم تداول يومي بالترليونات، تميل خطوط الاتجاه إلى أن تكون أكثر موثوقية واحترامًا، خاصة في الأطر الزمنية الأعلى. يتيح الوسطاء مثل Pepperstone، الذين يقدمون منصات مثل MT4 و MT5 و TradingView، للمتداولين التبديل بسهولة بين الأطر الزمنية ومراقبة هذه الديناميكيات المختلفة. يضمن الحجم الهائل للمشاركين أن المستويات الفنية المعترف بها على نطاق واسع، بما في ذلك خطوط الاتجاه، تحمل وزنًا أكبر.
ومع ذلك، قد يتصرف خط الاتجاه المرسوم على الرسم البياني لخمس دقائق في أصل أقل سيولة بشكل مختلف عن خط الاتجاه على الرسم البياني اليومي لزوج عملات رئيسي. كلما كان الإطار الزمني أقصر، كلما كان خط الاتجاه أكثر عرضة 'للضوضاء' – وهي تقلبات طفيفة لا تمثل تحولات كبيرة في المعنويات الأساسية. غالبًا ما توفر خطوط الاتجاه اليومية أو الأسبوعية، لأنها تقوم بتصفية الكثير من هذه الضوضاء قصيرة الأجل، إشارات تداول أكثر موثوقية وتدوم لفترة أطول. إنها تلتقط الاتجاه العام للسوق وتحظى عادة باحترام مجموعة واسعة من المشاركين في السوق.
هذا لا يعني أن خطوط الاتجاه ذات الأطر الزمنية الأقصر عديمة الفائدة. بالنسبة للمتداولين السكالبينغ (scalpers) أو المتداولين اليوميين (day traders)، يمكن أن يوفر خط الاتجاه لمدة 15 دقيقة أو ساعة واحدة إشارات صالحة وقابلة للتنفيذ تمامًا ضمن سياق اتجاه الإطار الزمني الأعلى. المفتاح هو فهم أن قوة خط الاتجاه تتناسب مع الإطار الزمني الذي تم رسمه عليه وسيولة الأصل الأساسي. تحقق دائمًا من الإطار الزمني الأعلى للتأكد من أن خط الاتجاه قصير الأجل الخاص بك ليس معاكسًا للاتجاه، مما يزيد المخاطر بطبيعته. خط الاتجاه الذي يتماشى مع الاتجاه العام للسوق، بغض النظر عن الإطار الزمني، سيوفر دائمًا فرص تداول أكثر موثوقية.
إدارة المخاطر باستخدام خطوط الاتجاه: أوامر وقف الخسارة والأهداف
رسم خط اتجاه مثالي هو نصف المعركة فقط؛ النصف الآخر هو معرفة كيفية إدارة مخاطرك حوله. على سبيل المثال، يجب أن يكون وضع أمر وقف الخسارة (stop-loss) منطقيًا دائمًا وأن يرتبط مباشرة بدور خط الاتجاه. إذا كنت تدخل صفقة شراء (long trade) عند ارتداد من خط اتجاه دعم، فيجب وضع أمر وقف الخسارة الخاص بك أسفل خط الاتجاه مباشرة، مما يسمح بهامش صغير لمراعاة التقلبات الطفيفة أو الاختراقات الكاذبة. قد يكون هذا الهامش بضعة نقاط (pips) أو نسبة مئوية، اعتمادًا على تحمل المخاطر لديك وتقلبات السوق. الوضع الدقيق أمر بالغ الأهمية؛ فإذا كان قريبًا جدًا، فإنك تخاطر بالخروج من الصفقة مبكرًا (stopped out)؛ وإذا كان بعيدًا جدًا، فإن نسبة المخاطرة إلى العائد (risk-to-reward ratio) لديك ستتأثر.
وبالمثل، إذا كنت تتخذ مركز بيع (short position) بعد اختراق وإعادة اختبار لخط اتجاه تحول من دعم إلى مقاومة، فيجب أن يكون أمر وقف الخسارة الخاص بك أعلى من تلك المقاومة المتشكلة حديثًا مباشرة. الفكرة هي أنه إذا تحرك السعر بما يتجاوز أمر وقف الخسارة الخاص بك، فمن المحتمل أن تكون فرضية صفقتك (أن خط الاتجاه سيصمد كمقاومة) قد أصبحت باطلة. تتضمن إدارة المخاطر أيضًا فهم الرافعة المالية (leverage). يعمل العديد من متداولي التجزئة، وخاصة في أوروبا، بموجب قيود على الرافعة المالية، مثل الحد الأقصى 1:30 لأزواج العملات الرئيسية الذي تفرضه ESMA، كما هو مفصل على موقعهم الإلكتروني. وهذا يعني أن حركة سعر صغيرة نسبيًا ضدك يمكن أن تؤدي إلى خسائر كبيرة إذا لم يتم التحكم في حجم مركزك بعناية، بغض النظر عن دقة خط الاتجاه الخاص بك.
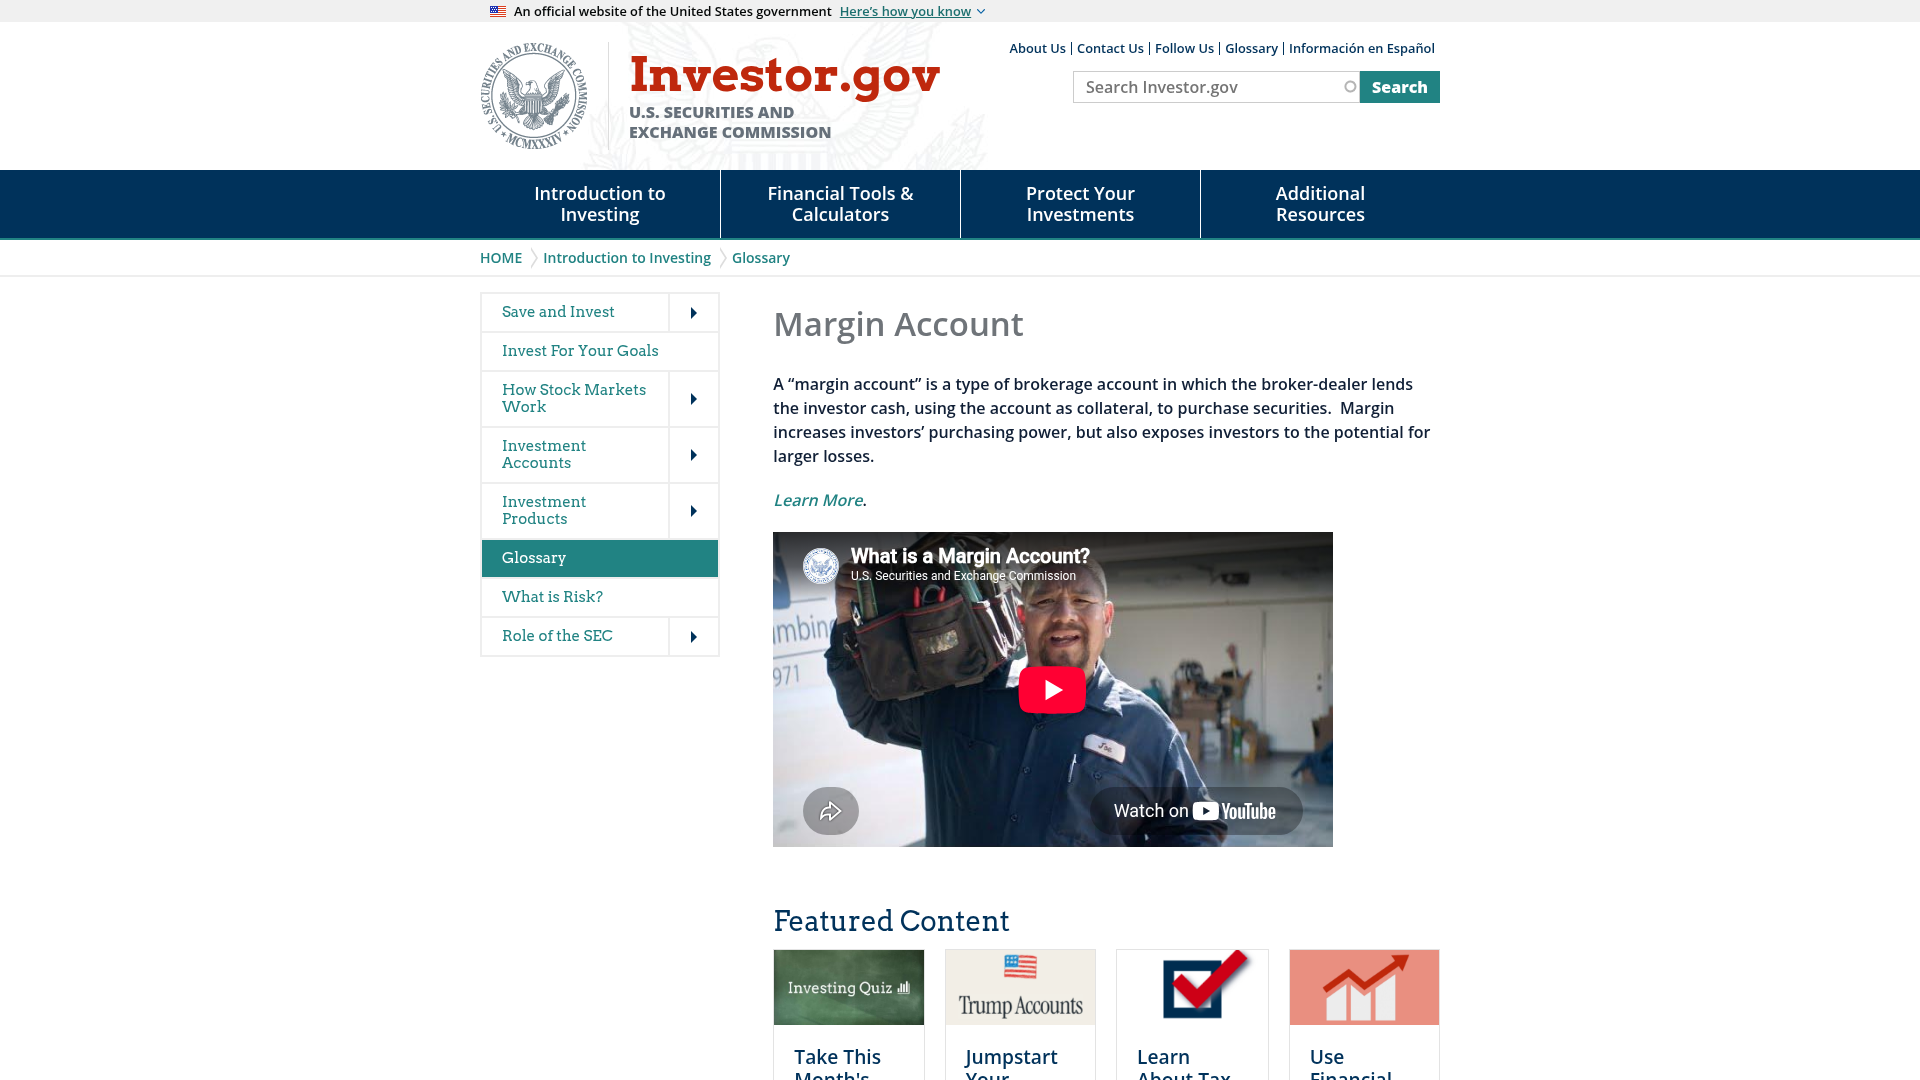
يتكامل تحديد أهداف الربح أيضًا مع تحليل خط الاتجاه. في الاتجاه الصعودي، قد تستهدف مستوى المقاومة الهام التالي أو امتدادًا متوقعًا للاتجاه الحالي. على سبيل المثال، إذا اخترق السعر خط اتجاه مقاومة رئيسي، فقد تتوقع هدفًا بناءً على القمة المتأرجحة السابقة (swing high) التي أدت إلى تشكيل خط الاتجاه. لا تتداول أبدًا بدون أمر وقف خسارة واضح وهدف ربح. تساعدك خطوط الاتجاه على تحديد هذه النقاط، وتحويل فكرة غامضة إلى خطة تداول ملموسة. تمامًا كما تحذر Investor.gov بشأن التداول بالهامش (margin trading)، افهم أنه بينما توفر خطوط الاتجاه الدقة، فإنها لا تقضي على المخاطر؛ بل تساعدك على تحديدها وإدارتها.
المزالق الشائعة وكيفية تجنبها
حتى مع الفهم القوي لآليات خطوط الاتجاه، غالبًا ما يقع المتداولون في فخاخ يمكن التنبؤ بها. أحد أكثر المزالق شيوعًا هو 'الرسم المفرط' (over-drawing) – أي إغراق الرسوم البيانية الخاصة بك بالعديد من خطوط الاتجاه، أو رسمها حيث لا يوجد اتجاه واضح. إذا كان الرسم البياني الخاص بك يبدو كشبكة عنكبوت، فمن المحتمل أنك ترى أنماطًا غير موجودة وتولد إشارات متضاربة. بَسّط. ركز على أبرز خطوط الاتجاه المؤكدة التي تلتقط حركات الأسعار الهامة بشكل حقيقي.
خطأ شائع آخر هو التمسك الصارم بخط اتجاه قام السوق بإبطاله بوضوح. خطوط الاتجاه هي أدوات ديناميكية؛ تتطور مع حركة السعر. إذا اخترق السعر خط اتجاه بقوة، وخاصة إذا أعاد اختباره من الجانب الآخر، فإن خط الاتجاه القديم لم يعد صالحًا. محاولة فرض ملاءمته أو تجاهل الاختراق هو وصفة للخسائر العنيدة. كن مستعدًا لتعديل خطوطك، أو رسم خطوط جديدة، أو حتى إزالتها بالكامل عندما تتغير ظروف السوق. الهدف ليس أن تكون 'صحيحًا' بشأن رسمك الأولي، بل أن تعكس بدقة هيكل السوق الحالي.
أخيرًا، تجنب التعامل مع خط الاتجاه كمؤشر مستقل. تتضاعف قوته عند استخدامه بالاقتران مع أدوات أخرى. يضيف التأكيد من مستويات الدعم والمقاومة الأفقية، أو المتوسطات المتحركة (moving averages)، أو أنماط الشموع اليابانية طبقات من التقارب، مما يزيد من احتمالية نجاح الصفقة. خط الاتجاه بحد ذاته هو دليل قوي، ولكن خط الاتجاه المؤكد بعوامل متعددة هو إعداد تداول ذو احتمالية عالية. من خلال الإقرار بهذه الأخطاء الشائعة والعمل بنشاط لتجنبها، يمكنك تحويل تحليل خط الاتجاه الخاص بك من مجرد تمرين رسم بياني بسيط إلى استراتيجية تداول مربحة باستمرار.
اقرأ المصدر الأساسي
تحقق من ذلك لدى الجهة التنظيمية، وليس لدينا
لقطات شاشة للصفحات الرسمية التي تستند إليها القواعد في هذا الدليل. افتحها بنفسك — فكلمات الجهة التنظيمية نفسها دائمًا ما تكون أفضل من ملخص لها.
الأسئلة المتكررة
المصادر
من أين جاء هذا
بقلم Daniel Okafor
مؤلف المناهج. نقدم تعليماً منظماً ومبسطاً في الفوركس باللغة الإنجليزية للأشخاص الذين يتعلمون من الصفر. الفهم أولاً، دائماً — وليس نصيحة مالية أبداً. الدورة التدريبية نفسها موجودة في الـ المناهج.
واصل التعلم
إلى أين يقود هذا الدليل لاحقاً
الأدلة الأقرب إلى هذا الدليل، بالترتيب الذي تبني عليه. كل منها قراءة كاملة بحد ذاتها، ولا يفترض أي منها أنك انتهيت من هذه الصفحة.
- تمرين العشر دقائق لتحديد المستويات الأفقية على الرسم البياني النظيفتعلم طريقة دقيقة وسريعة لتحديد ورسم مستويات الدعم والمقاومة الأفقية الحرجة على أي رسم بياني، مما يهيئك لاتخاذ قرارات تداول أكثر…
- حقيقة ذيول الشموع الطويلة: ما تخبرك به، وما لا تخبرك بهتعلم كيفية تفسير ذيول الشموع كدليل مرئي لرفض السعر ومعنويات السوق، ولكن افهم قيودها الحاسمة قبل اتخاذ أي قرارات.
- إتقان سياق السوق: لماذا تحدد الأطر الزمنية الأعلى نجاح الدخوليتجاهل العديد من المتداولين السياق الحاسم الذي توفره الأطر الزمنية الأعلى، مما يؤدي غالبًا إلى خسائر يمكن تجنبها؛ فهم الصورة الأكبر…
- رسوم الخطوط والأعمدة والشموع: اختيار نافذتك على السوقيُعد فهم كيفية تصور السعر أمرًا أساسيًا؛ يشرح هذا الدليل الرسوم البيانية الخطية، الشريطية، والشموع اليابانية لمساعدتك في اختيار…
- شمعة الابتلاع: آليات وليست سحراًتعرّف على الآليات المباشرة لأنماط الشموع الابتلاعية الصاعدة والهابطة وكيفية دمجها في استراتيجية تداول.